Theory of Consumer Behaviour (Microeconomics) — Important Questions
59 questions
With answersCBSE format
SUMMARY: The chapter "Theory of Consumer Behaviour" in Class 11 Economics explores how consumers make decisions to allocate their resources among various goods and services to maximize their satisfaction. KEY TOPICS: utility, marginal utility, law of diminishing marginal utility, indifference curve analysis, budget constraint, consumer equilibrium, demand curve, price effect, substitution effect, income effect
A(% change in price) / (% change in quantity demanded)
B(% change in quantity demanded) / (% change in price)
C(change in quantity) × (change in price)
D(change in price) / (change in quantity)
Check answerHide answer
Correct answer: Option 2 — (% change in quantity demanded) / (% change in price)
Q61 Mark
Which of the following best defines 'Marginal Utility'?
ATotal satisfaction derived from consuming all units of a good
BAdditional satisfaction gained from consuming one more unit of a good
CAverage satisfaction derived from consuming a good
DSatisfaction derived from the first unit of a good consumed
Check answerHide answer
Correct answer: Option 2 — Additional satisfaction gained from consuming one more unit of a good
Q71 Mark
The Law of Diminishing Marginal Utility states that as a consumer consumes more units of a good:
ATotal utility decreases at an increasing rate
BMarginal utility increases with each additional unit
CMarginal utility decreases with each additional unit consumed
DTotal utility remains constant regardless of consumption
Check answerHide answer
Correct answer: Option 3 — Marginal utility decreases with each additional unit consumed
Q81 Mark
An indifference curve is convex to the origin because of:
AThe law of diminishing marginal utility
BThe diminishing marginal rate of substitution
CThe consumer's fixed income constraint
DThe increasing marginal rate of substitution
Check answerHide answer
Correct answer: Option 2 — The diminishing marginal rate of substitution
Q91 Mark
At consumer equilibrium using the utility analysis approach, a consumer spending on two goods X and Y must satisfy which condition?
AMUx / Px = MUy / Py = MU of money
BMUx × Px = MUy × Py
CMUx + MUy = Total income
DMUx / MUy = Px + Py
Check answerHide answer
Correct answer: Option 1 — MUx / Px = MUy / Py = MU of money
Q101 Mark
Which of the following is a property of indifference curves?
ATwo indifference curves can intersect each other
BAn indifference curve slopes upward from left to right
CA higher indifference curve represents a higher level of satisfaction
DIndifference curves are always parallel to each other
Check answerHide answer
Correct answer: Option 3 — A higher indifference curve represents a higher level of satisfaction
Q111 Mark
When the price of a good falls, the substitution effect refers to:
AThe consumer buying more of the good because real income has increased
BThe consumer substituting the now relatively cheaper good for other goods
CThe consumer shifting to a higher indifference curve
DA change in the consumer's money income due to the price change
Check answerHide answer
Correct answer: Option 2 — The consumer substituting the now relatively cheaper good for other goods
Q121 Mark
A budget line shifts parallel to the right when:
AThe price of one good increases while the other remains constant
BThe consumer's money income increases, prices remaining unchanged
CThe prices of both goods increase proportionately
DThe consumer's money income decreases, prices remaining unchanged
Check answerHide answer
Correct answer: Option 2 — The consumer's money income increases, prices remaining unchanged
Q131 Mark
If a consumer's income increases and the demand for a good decreases, the good is classified as:
AA normal good
BA substitute good
CAn inferior good
DA complementary good
Check answerHide answer
Correct answer: Option 3 — An inferior good
Q141 Mark
In indifference curve analysis, consumer equilibrium is achieved at the point where:
AThe budget line cuts the indifference curve at two points
BThe marginal rate of substitution equals the ratio of prices of the two goods and the budget line is tangent to the indifference curve
CThe consumer spends equal amounts on both goods
DThe indifference curve is at its highest point on the budget line
Check answerHide answer
Correct answer: Option 2 — The marginal rate of substitution equals the ratio of prices of the two goods and the budget line is tangent to the indifference curve
Q151 Mark
For a Giffen good, when its price falls, the income effect is negative and stronger than the substitution effect. What happens to the quantity demanded?
AQuantity demanded increases as price falls, following the normal demand law
BQuantity demanded remains unchanged regardless of price change
CQuantity demanded decreases even as price falls, making the demand curve upward sloping
DQuantity demanded increases only if the consumer's income also increases simultaneously
Check answerHide answer
Correct answer: Option 3 — Quantity demanded decreases even as price falls, making the demand curve upward sloping
Short Answer Questions10 questions
Q163 Marks
State the law of diminishing marginal utility.
View sample solutionHide solution
As a consumer consumes more units of a good in a given time period, the additional (marginal) utility derived from each extra unit eventually declines, other things remaining the same. This is why consumers are willing to pay less for additional units and why the demand curve for most goods slopes downward.
Q173 Marks
Define an indifference curve and state any two of its properties.
View sample solutionHide solution
An indifference curve shows the different combinations of two goods that give a consumer the same level of total satisfaction. Properties: (i) It slopes downward to the right because more of one good requires less of the other for the same satisfaction. (ii) Higher indifference curves represent higher satisfaction. (iii) Two indifference curves cannot intersect. (iv) Indifference curves are convex to the origin because the marginal rate of substitution diminishes.
Q183 Marks
State the condition for consumer equilibrium under the indifference curve approach.
View sample solutionHide solution
A consumer is in equilibrium where the highest attainable indifference curve is tangent to the budget line. Two conditions must hold: (i) the marginal rate of substitution (MRSxy) equals the price ratio Px / Py, and (ii) the indifference curve must be convex to the origin at the point of tangency so that equilibrium is a true maximum.
Q193 Marks
Define price elasticity of demand and state its formula.
View sample solutionHide solution
Price elasticity of demand (Ed) is the responsiveness of the quantity demanded of a good to a change in its own price, measured as the ratio of the percentage change in quantity demanded to the percentage change in price. Ed = (% ΔQ) / (% ΔP). By convention we take the absolute value. |Ed| > 1 is elastic, < 1 inelastic, = 1 unitary elastic.
Q203 Marks
Define income elasticity of demand with one example.
View sample solutionHide solution
Income elasticity of demand (Ey) = (% change in quantity demanded) / (% change in income). For a normal good Ey > 0 (demand rises with income); for an inferior good Ey < 0 (e.g. lower-quality food grains whose demand falls as income rises); Ey > 1 indicates a luxury good.
Q213 Marks
Define marginal utility. How does it differ from total utility?
View sample solutionHide solution
Marginal utility is the additional satisfaction gained from consuming one more unit of a good or service. Total utility, on the other hand, is the total satisfaction obtained from consuming all units of a good. While total utility generally increases with consumption (up to a point), marginal utility tends to decrease with each additional unit consumed.
Q223 Marks
What is a budget constraint? How does it affect consumer choice?
View sample solutionHide solution
A budget constraint represents the combinations of goods and services that a consumer can purchase given their income and the prices of goods. It limits the consumer's choices to only those bundles that are affordable. The consumer must choose a combination of goods that lies on or within the budget line.
Q233 Marks
What is the Marginal Rate of Substitution (MRS) and why does it diminish?
View sample solutionHide solution
The Marginal Rate of Substitution (MRS) is the rate at which a consumer is willing to give up one good in exchange for one more unit of another good, while maintaining the same level of satisfaction. MRS diminishes because as a consumer acquires more of one good, they are willing to sacrifice fewer units of the other good for it, reflecting the principle of diminishing marginal utility.
Q243 Marks
Explain the condition for consumer equilibrium using the utility analysis approach.
View sample solutionHide solution
According to utility analysis, a consumer reaches equilibrium when the marginal utility of a good equals its price (MU = P) for a single good. For multiple goods, equilibrium is achieved when the ratio of marginal utility to price is equal across all goods: MU₁/P₁ = MU₂/P₂. At this point, the consumer maximizes total utility given the budget constraint.
Q253 Marks
Distinguish between the substitution effect and the income effect of a price change.
View sample solutionHide solution
The substitution effect refers to the change in quantity demanded of a good due to a change in its relative price, keeping real income constant — consumers substitute the cheaper good for the relatively expensive one. The income effect refers to the change in quantity demanded resulting from the change in the consumer's real purchasing power caused by the price change. Together, these two effects constitute the total price effect.
Long Answer Questions6 questions
Q266 Marks
Explain cardinal utility approach to consumer equilibrium.
View sample solutionHide solution
Cardinal utility assumes utility is measurable in units ('utils'). Assumptions: rational consumer, fixed income and prices, constant marginal utility of money, independent utilities. For a single good the consumer buys where MU = price (in utils per rupee). For two goods x and y the equilibrium condition is MUx / Px = MUy / Py = MU of money; i.e. the marginal utility per rupee spent must be equal across all goods. If MUx / Px > MUy / Py the consumer shifts rupees from y to x, and by the law of diminishing marginal utility the ratios move towards equality. The analysis explains why demand slopes downward (at lower price of x, more is purchased until MU / P falls to the old ratio).
Q276 Marks
Derive the consumer's demand curve for a good using the indifference-curve approach.
View sample solutionHide solution
Start with a consumer in equilibrium at point E1 where the budget line is tangent to an indifference curve. Now suppose the price of good x falls, other things unchanged. The budget line pivots outward along the x-axis, reaching a higher indifference curve; the new equilibrium E2 involves more of x. Successive price cuts trace a price-consumption curve. Plot each pair (price of x, quantity of x) on a new graph: the resulting locus is the consumer's demand curve for x. Its downward slope reflects both a substitution effect (x is now cheaper relative to y, consumer substitutes towards x) and an income effect (real income has risen). For a normal good both effects reinforce each other, giving a classical downward-sloping demand curve.
Q286 Marks
Explain the law of demand and its exceptions.
View sample solutionHide solution
Law of demand: other things equal, as the price of a good falls, the quantity demanded rises and vice versa. Reasons: (i) substitution effect — cheaper good is substituted for others; (ii) income effect — real income rises, so more is consumed; (iii) diminishing marginal utility — at a lower price, consumers buy more until MU equals the lower price. Exceptions: (a) Giffen goods — inferior food-grains where the negative income effect dominates the substitution effect; quantity demanded rises as price rises. (b) Veblen / conspicuous goods — luxury items bought for their snob value; higher price signals prestige. (c) Expectations of further price change — if prices are expected to rise, consumers buy more now. (d) Ignorance of substitutes or irrational behaviour.
Q296 Marks
Discuss the main determinants of market demand for a good.
View sample solutionHide solution
(1) Own price — law of demand: a fall in price raises quantity demanded. (2) Price of related goods — substitutes (e.g. tea and coffee) and complements (e.g. petrol and cars) shift the demand curve when their prices change. (3) Consumer income — demand for normal goods rises with income; for inferior goods, falls. (4) Tastes and preferences — shaped by advertising, fashion, culture. (5) Expectations — if buyers expect prices to rise in future they may buy more today. (6) Number of buyers — larger population or expanded market shifts demand rightward. (7) Income distribution — a given average income distributed more evenly may raise demand for mass consumer goods. (8) Demographic structure — age composition, family size. Understanding these helps a firm forecast and a government design policy.
Q306 Marks
Calculate the price elasticity of demand using the percentage method for the following data. Original price = ₹50; new price = ₹60. Original quantity = 100 units; new quantity = 80 units. Interpret the result.
View sample solutionHide solution
% change in price = ((60 − 50) / 50) × 100 = 20%. % change in quantity demanded = ((80 − 100) / 100) × 100 = −20%. Ed = (% ΔQ) / (% ΔP) = −20 / 20 = −1; in absolute value 1. Interpretation: since |Ed| = 1, demand is unitary elastic at this point — the percentage fall in quantity exactly matches the percentage rise in price, so total expenditure remains unchanged (100 × 50 = 5000; 80 × 60 = 4800 — approximately constant, slightly lower due to the arc-versus-point difference). For |Ed| > 1 demand would be elastic (larger quantity response); for |Ed| < 1 it would be inelastic.
Q316 Marks
Compare cardinal utility and ordinal utility approaches with the help of a table.
Assertion–Reason Questions8 questions
Q321 Mark
Assertion (A): Indifference curves are convex to the origin.
Reason (R): The marginal rate of substitution between two goods diminishes along an indifference curve.
Show explanationHide explanation
Correct answer: Option 1 —
Both A and R are true, and R is the correct explanation of A.
Q331 Mark
Assertion (A): The demand curve for a normal good slopes downward from left to right.
Reason (R): As price falls substitution and income effects combine to raise the quantity demanded.
Show explanationHide explanation
Correct answer: Option 1 —
Both A and R are true, and R is the correct explanation of A.
Q341 Mark
Assertion (A): Higher indifference curves represent higher levels of satisfaction.
Reason (R): They represent bundles with more of at least one good and no less of the other.
Show explanationHide explanation
Correct answer: Option 1 —
Both A and R are true, and R is the correct explanation of A.
Q351 Mark
Assertion (A): Giffen goods violate the law of demand.
Reason (R): Giffen goods have a positive income elasticity of demand.
Show explanationHide explanation
Correct answer: Option 2 —
Both A and R are true, but R is not the correct explanation of A.
Q361 Mark
Assertion (A): The slope of the budget line equals the price ratio Px / Py.
Reason (R): It shows the rate at which the market lets the consumer substitute one good for the other.
Show explanationHide explanation
Correct answer: Option 1 —
Both A and R are true, and R is the correct explanation of A.
Q371 Mark
Assertion (A): Total utility increases at a decreasing rate as more units of a commodity are consumed.
Reason (R): Marginal utility diminishes as additional units of a commodity are consumed.
Show explanationHide explanation
Correct answer: Option 1 —
Both A and R are true, and R is the correct explanation of A.
Q381 Mark
Assertion (A): A consumer reaches equilibrium when marginal utility equals the price of the commodity.
Reason (R): At consumer equilibrium, the consumer maximizes total utility by equating MU/P across all goods.
Show explanationHide explanation
Correct answer: Option 1 —
Both A and R are true, and R is the correct explanation of A.
Q391 Mark
Assertion (A): An indifference curve is convex to the origin.
Reason (R): The marginal rate of substitution increases as a consumer moves along an indifference curve.
Show explanationHide explanation
Correct answer: Option 3 —
A is true, but R is false.
Statement-Based Questions8 questions
Q401 Mark
Statement 1: Utility is a subjective experience.
Statement 2: Utility cannot, in practice, be measured cardinally on an objective scale.
Show answerHide answer
Correct answer: Option 1 —
Both statements are true.
Q411 Mark
Statement 1: Total utility continues to rise even after marginal utility becomes negative.
Statement 2: Total utility reaches its maximum when marginal utility is zero.
Show answerHide answer
Correct answer: Option 4 —
Both statements are false.
Q421 Mark
Statement 1: Own-price elasticity of demand is conventionally expressed as an absolute value.
Statement 2: The underlying ratio of percentage changes is negative for normal goods.
Show answerHide answer
Correct answer: Option 1 —
Both statements are true.
Q431 Mark
Statement 1: Income elasticity of demand is positive for a normal good.
Statement 2: Income elasticity of demand is negative for an inferior good.
Show answerHide answer
Correct answer: Option 1 —
Both statements are true.
Q441 Mark
Statement 1: A change in the consumer's income shifts the budget line parallel to itself.
Statement 2: A change in the price of one good rotates the budget line around one of its intercepts.
Show answerHide answer
Correct answer: Option 1 —
Both statements are true.
Q451 Mark
Statement 1: Marginal utility is the additional utility gained from consuming one more unit of a good.
Statement 2: Total utility continues to increase even when marginal utility becomes negative.
Show answerHide answer
Correct answer: Option 2 —
Only Statement 1 is true.
Q461 Mark
Statement 1: According to the Law of Diminishing Marginal Utility, as a consumer consumes more units of a good, the marginal utility derived from each successive unit decreases.
Statement 2: The Law of Diminishing Marginal Utility applies only to luxury goods and not to necessity goods.
Show answerHide answer
Correct answer: Option 2 —
Only Statement 1 is true.
Q471 Mark
Statement 1: An indifference curve slopes downward from left to right because of the negative relationship between the two goods on the curve.
Statement 2: Two indifference curves can intersect each other without violating any assumption of consumer theory.
Show answerHide answer
Correct answer: Option 2 —
Only Statement 1 is true.
Case Study / Passage Questions4 questions
Q483 Marks
Rita consumes bananas one after the other and reports her satisfaction. The first banana gives her 10 utils of utility; the second adds 8 more; the third 6; the fourth 4; the fifth 2; the sixth 0; the seventh actually reduces her satisfaction by 2 utils.
Total utility is at its maximum when Rita eats:
AAt the 3rd banana
BAt the 5th banana
CAt the 6th banana
DAt the 7th banana
The data illustrate the law of diminishing marginal utility because:
AMU falls as more units are consumed
BMU rises continuously
CTU falls continuously
DMU remains constant
Describe the relationship between TU and MU using Rita's data.
Show answersHide answers
1. Option 3 — At the 6th banana
2. Option 1 — MU falls as more units are consumed
3. While MU remains positive (units 1-5), TU keeps rising though at a decreasing rate. At unit 6 MU is 0 and TU reaches its maximum. When MU becomes negative (unit 7), TU begins to fall. Thus TU is maximum exactly where MU = 0.
Q493 Marks
Meera can consume bundles of tea and biscuits. Bundle A = (4 tea, 2 biscuits); Bundle B = (3 tea, 4 biscuits); Bundle C = (2 tea, 7 biscuits); Bundle D = (1 tea, 12 biscuits). She reports that she is equally satisfied with all four bundles.
The four bundles lie:
AAlong the same indifference curve
BOn a higher indifference curve
COn a lower indifference curve
DOn the budget line
The marginal rate of substitution of biscuits for tea is:
ADiminishing
BIncreasing
CConstant
DZero
Why is an indifference curve convex to the origin?
Show answersHide answers
1. Option 1 — Along the same indifference curve
2. Option 1 — Diminishing
3. As Meera moves from A to B to C to D she gives up more biscuits for the same unit of tea lost (or equivalently, requires more biscuits to compensate for each lost tea unit). This diminishing MRS makes the indifference curve convex to the origin — and reflects the consumer's preference for balanced bundles over extreme ones.
Q503 Marks
When the price of a brand of coffee rises from ₹200 to ₹220 (a 10% rise), monthly sales fall from 1000 packs to 800 packs (a 20% fall). A competing brand's price goes up by the same 10% but its sales only fall from 1000 to 950 packs (a 5% fall).
The absolute price elasticity of demand for the first brand is:
A1.0
B0.5
C2.0
D0.2
The second brand's demand can best be described as:
APerfectly elastic
BElastic
CUnitary elastic
DInelastic
Calculate total revenue before and after the price change for both brands and interpret.
Show answersHide answers
1. Option 3 — 2.0
2. Option 4 — Inelastic
3. Total revenue for the first brand = 1000 × 200 = ₹2 00 000 at old price; 800 × 220 = ₹1 76 000 at new. Revenue falls because demand is elastic (|Ed|>1) — the percentage fall in quantity exceeds the percentage rise in price. For the second brand revenue rises from ₹2 00 000 to 950 × 220 = ₹2 09 000 because demand is inelastic.
Q514 Marks
Ramesh is a student who spends his pocket money on two goods: chocolates and chips. He notices that as he consumes more chocolates in a day, the satisfaction he gets from each additional chocolate keeps decreasing. For instance, the first chocolate gives him immense pleasure, the second gives less, and by the fifth chocolate, he barely enjoys it. This phenomenon is a fundamental principle in consumer behaviour theory. Economists use the concept of 'utility' to measure satisfaction, and 'marginal utility' refers to the additional utility gained from consuming one more unit of a good. Ramesh's experience perfectly illustrates a well-known economic law that governs consumer decision-making and helps explain why consumers diversify their consumption rather than spending all their money on a single good.
The phenomenon experienced by Ramesh where each additional chocolate gives less satisfaction is known as:
ALaw of Supply
BLaw of Diminishing Marginal Utility
CLaw of Demand
DLaw of Increasing Returns
What does 'Marginal Utility' mean?
When Ramesh consumes the 5th chocolate and barely enjoys it, his marginal utility at that point is most likely:
AIncreasing
BConstant
CVery low or approaching zero
DEqual to total utility
Explain how the Law of Diminishing Marginal Utility helps explain why consumers diversify their consumption among different goods.
Show answersHide answers
1. Option 2 — Law of Diminishing Marginal Utility
2. Marginal Utility refers to the additional utility or satisfaction gained from consuming one more unit of a good or service, keeping the consumption of all other goods constant.
3. Option 3 — Very low or approaching zero
4. As a consumer consumes more units of the same good, the marginal utility from each additional unit falls. To maximize total satisfaction, the consumer shifts spending to other goods where marginal utility is still high. This is why consumers spread their income across various goods rather than spending everything on one good.
Table-Based Questions4 questions
Q523 Marks
Study the TU / MU schedule and answer:
Units consumed
Total Utility (utils)
Marginal Utility (utils)
1
10
10
2
18
8
3
24
6
4
28
4
5
30
2
6
30
0
7
28
-2
TU is at its maximum at the:
A3rd
B5th
C6th
D7th
The schedule illustrates that:
AMU rises continuously
BMU falls and becomes negative
CMU stays at 10
DMU is constant at 6
Summarise the TU-MU relationship in one sentence.
Show answersHide answers
1. Option 3 — 6th
2. Option 2 — MU falls and becomes negative
3. When MU > 0, TU rises; when MU = 0, TU reaches its peak; when MU < 0, TU falls. This simple rule — TU rises, peaks and then falls as MU moves from positive through zero to negative — links the two concepts and underpins why the rational consumer stops at the unit where MU ≈ price (in rupees of equivalent utility per rupee).
Q533 Marks
Study the price-elasticity cases and answer:
Case
%ΔP
%ΔQ
Ed (abs)
Nature of demand
I
10
20
2.0
Elastic
II
10
10
1.0
Unitary
III
10
5
0.5
Inelastic
IV
10
0
0
Perfectly inelastic
Which case has unitary elastic demand?
ACase I
BCase II
CCase III
DCase IV
When demand is elastic and price rises total revenue:
AFalls
BRises
CRemains constant
DBecomes negative
How does price elasticity affect a seller's decision to raise or lower price?
Show answersHide answers
1. Option 2 — Case II
2. Option 1 — Falls
3. Price elasticity determines how total revenue changes with price: elastic demand — TR moves opposite to price; inelastic demand — TR moves in the same direction as price; unitary elastic demand — TR is unchanged. Sellers therefore target pricing based on knowledge of elasticity.
Q545 Marks
Using the percentage method compute the price elasticity of demand from the data.
Situation
Price (₹)
Quantity demanded
Before
50
100
After
60
80
Q554 Marks
Given total utility, compute marginal utility and identify the point at which TU is maximised.
Units
TU (utils)
1
10
2
18
3
24
4
28
5
30
6
30
7
28
Picture-Based Questions4 questions
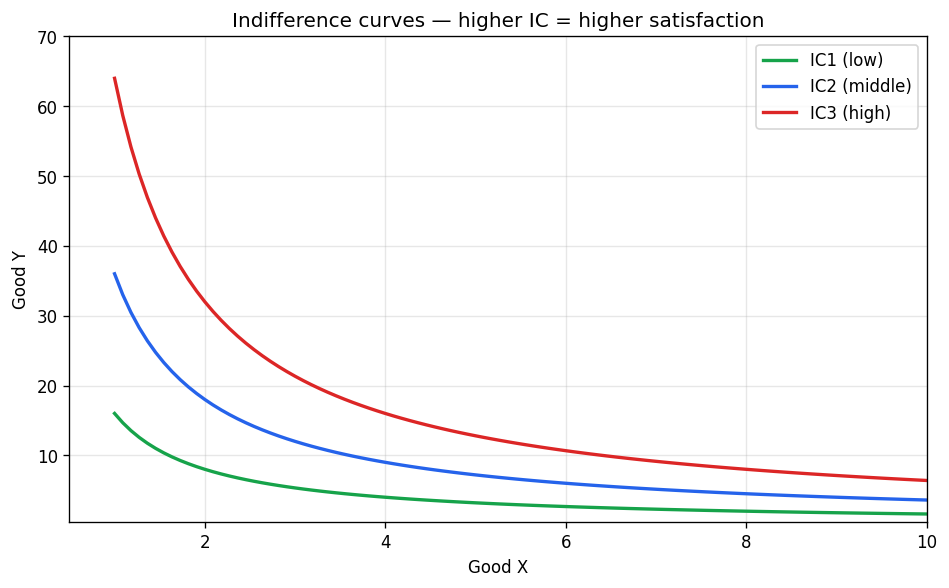
Q563 Marks
Study the family of indifference curves and answer:
Which indifference curve represents the highest level of satisfaction?
AIC1 (low)
BIC2 (middle)
CIC3 (high)
DAll equal
The convex shape of each indifference curve reflects:
AConstant MRS
BDiminishing MRS
CIncreasing MRS
DZero MRS
Why can two indifference curves never intersect?
Show answersHide answers
1. Option 3 — IC3 (high)
2. Option 2 — Diminishing MRS
3. Two indifference curves cannot intersect because each curve represents a different level of satisfaction; if they crossed, the same combination would give two different utility levels simultaneously, violating the consumer's transitivity of preferences.
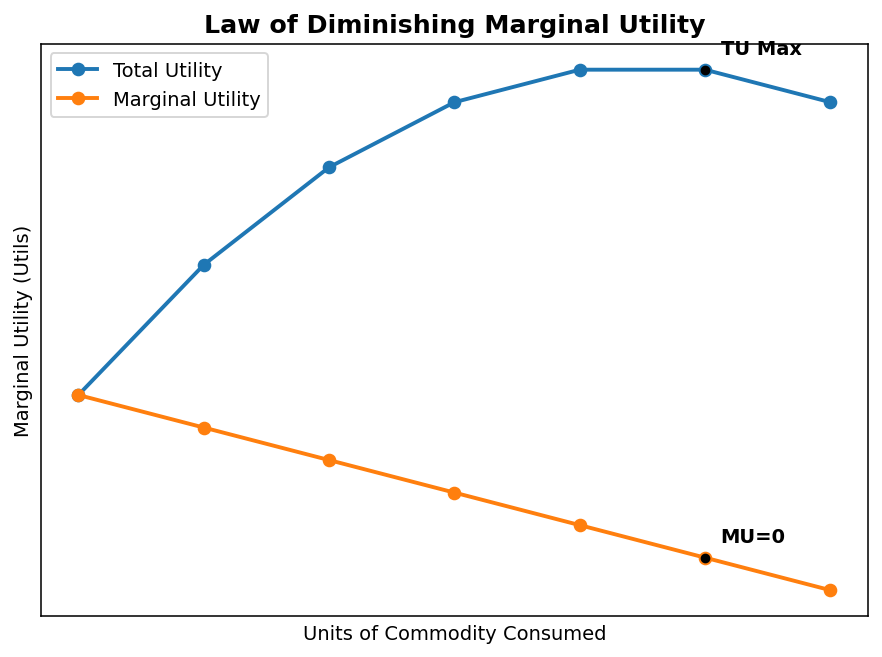
Q574 Marks
Based on the given graph showing the Law of Diminishing Marginal Utility, answer the following:
At which unit of consumption does Marginal Utility become zero?
A4th unit
B5th unit
C6th unit
D7th unit
What happens to Total Utility when Marginal Utility becomes negative (7th unit)?
ATotal Utility increases
BTotal Utility remains constant
CTotal Utility decreases
DTotal Utility becomes zero
State the Law of Diminishing Marginal Utility as illustrated by the graph.
What is the relationship between Total Utility and Marginal Utility when TU is at its maximum?
Show answersHide answers
1. Option 3 — 6th unit
2. Option 3 — Total Utility decreases
3. The Law of Diminishing Marginal Utility states that as a consumer consumes more and more units of a commodity, the marginal utility derived from each successive unit goes on diminishing. As shown in the graph, MU falls from 20 utils at the 1st unit to 0 at the 6th unit and becomes negative at the 7th unit.
4. When Total Utility is at its maximum (at the 6th unit), Marginal Utility is equal to zero. This is the point of consumer satiety where the consumer has no incentive to consume more.
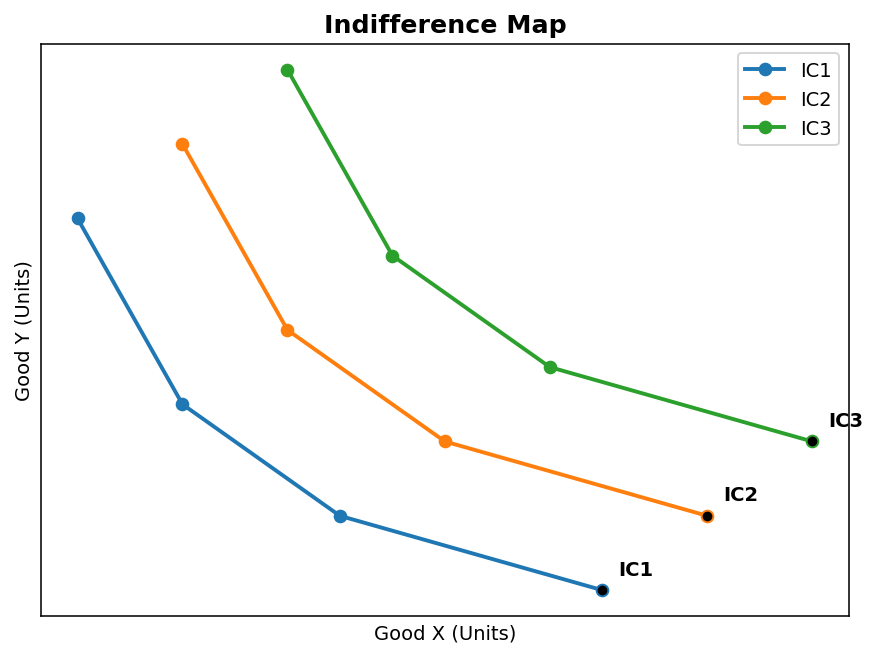
Q584 Marks
Based on the given graph showing an Indifference Map with multiple Indifference Curves, answer the following:
Which indifference curve in the map represents the highest level of consumer satisfaction?
AIC1
BIC2
CIC3
DAll give equal satisfaction
Why do indifference curves slope downward from left to right?
ABecause the consumer prefers less of both goods
BBecause to maintain the same level of satisfaction, if more of one good is consumed, less of the other must be consumed
CBecause both goods are inferior goods
DBecause the budget of the consumer is fixed
Can two indifference curves intersect each other? Give reason.
What does the Marginal Rate of Substitution (MRS) measure, and what is its behaviour along a typical indifference curve?
Show answersHide answers
1. Option 3 — IC3
2. Option 2 — Because to maintain the same level of satisfaction, if more of one good is consumed, less of the other must be consumed
3. No, two indifference curves can never intersect each other. If they did, the point of intersection would represent the same level of satisfaction on two different indifference curves, which is a contradiction. Each IC represents a unique level of utility, so they cannot cross.
4. MRS measures the rate at which a consumer is willing to substitute one good for another while maintaining the same level of satisfaction. Along a typical indifference curve, MRS diminishes as the consumer moves down the curve — this is the Law of Diminishing MRS — because as the consumer gets more of Good X, they are willing to give up less and less of Good Y for an additional unit of X.
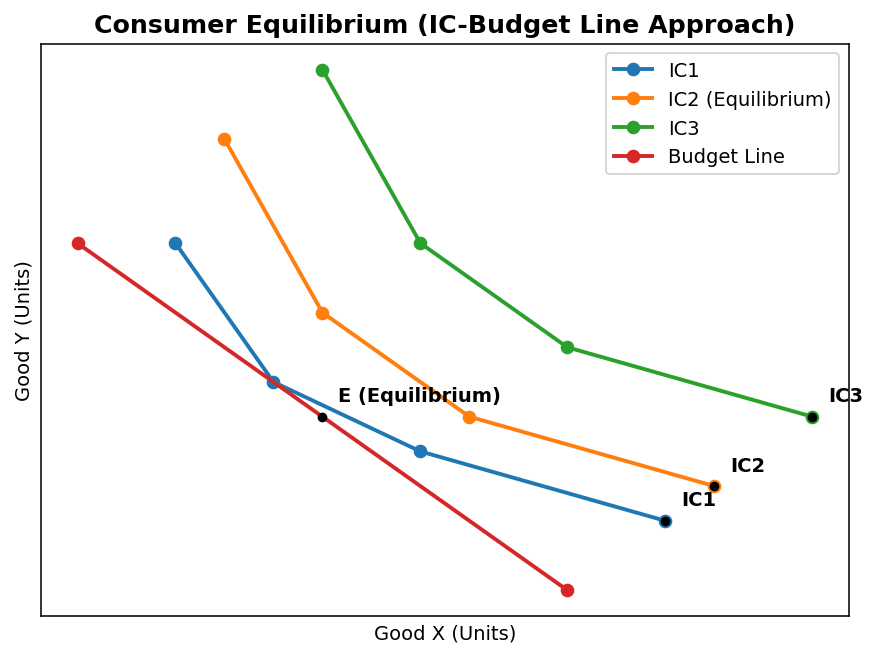
Q594 Marks
Based on the given graph showing Consumer Equilibrium using the Indifference Curve approach, answer the following:
At the point of consumer equilibrium (E), which of the following conditions holds true?
AMRS > Price Ratio (Px/Py)
BMRS < Price Ratio (Px/Py)
CMRS = Price Ratio (Px/Py)
DMRS = 0
Why can the consumer not reach IC3 in the given graph?
ABecause IC3 gives lower satisfaction than IC2
BBecause IC3 lies beyond the budget line and is unaffordable
CBecause IC3 intersects the budget line
DBecause the consumer prefers IC1
What does the budget line represent in the context of consumer behaviour?
What happens to the consumer's equilibrium if the price of Good X falls, assuming income and price of Good Y remain constant?
Show answersHide answers
1. Option 3 — MRS = Price Ratio (Px/Py)
2. Option 2 — Because IC3 lies beyond the budget line and is unaffordable
3. The budget line (also called the price line) represents all possible combinations of two goods that a consumer can purchase with a given income and at given prices. It shows the consumer's purchasing power constraint. Any point on or inside the budget line is affordable, while points beyond it are not.
4. If the price of Good X falls, the budget line rotates outward (pivots) on the X-axis, as the consumer can now afford more of Good X with the same income. This shifts the equilibrium to a higher indifference curve, and the consumer purchases more of Good X. This illustrates the price effect, which can be decomposed into the substitution effect and the income effect.