1. Option 3 — Direct Personal Interview
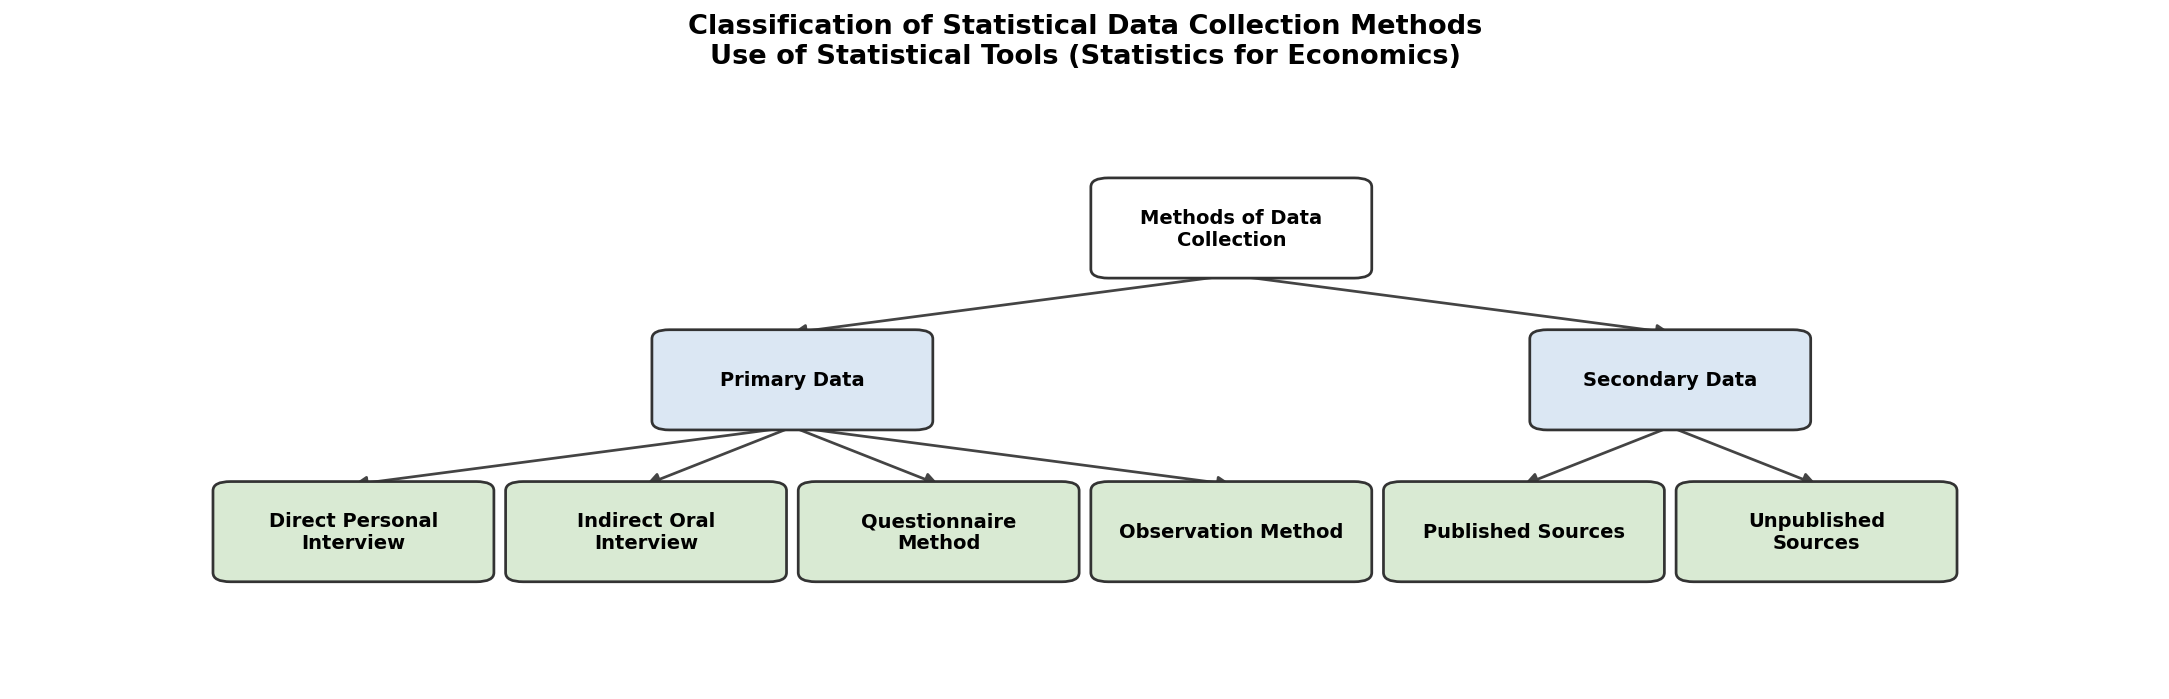
2. Primary Data is collected for the first time by the investigator for a specific purpose, while Secondary Data is data that has already been collected and published or recorded by someone else.
3. Option 3 — Questionnaire Method
4. Published Source: Reports published by the Reserve Bank of India (RBI) or Census of India. Unpublished Source: Records maintained by a private firm or an individual researcher's notes.
5. Option 3 — Arithmetic Mean
6. Measures of Central Tendency (Mean, Median, Mode) describe the central or typical value of a dataset, showing where data tends to cluster. Measures of Dispersion (Range, Mean Deviation, Standard Deviation) describe the spread or variability of data around the central value, indicating how scattered the data is.
7. Option 4 — Standard Deviation
8. The Lorenz Curve is a graphical measure of dispersion used to represent the inequality in the distribution of income or wealth in an economy. It plots the cumulative percentage of income against the cumulative percentage of the population. The farther the Lorenz Curve is from the line of equal distribution (diagonal), the greater the inequality.