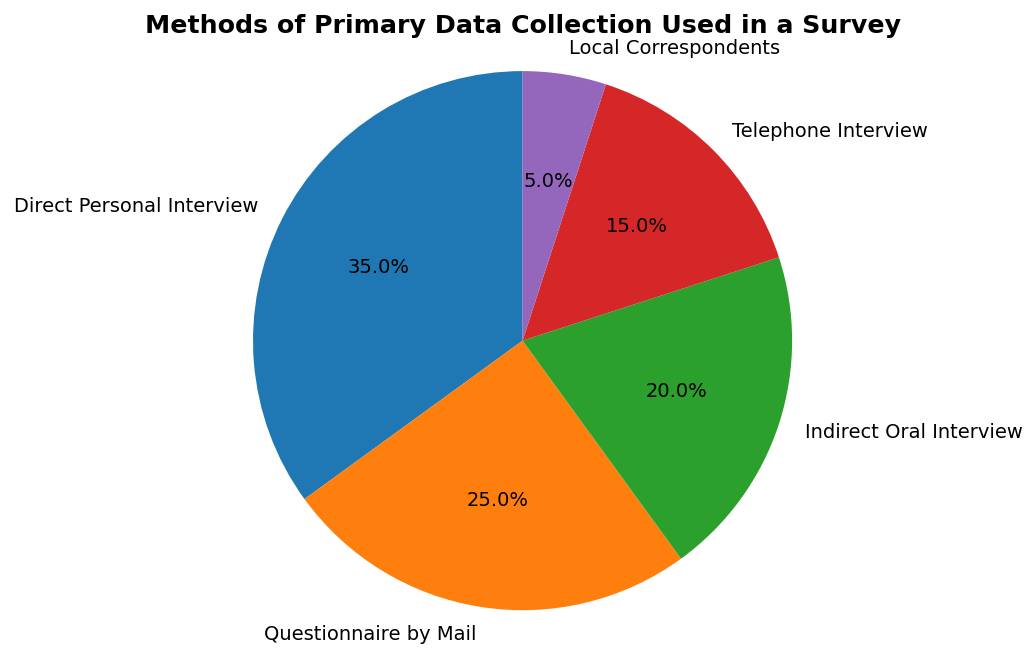
1. Option 3 — Direct Personal Interview
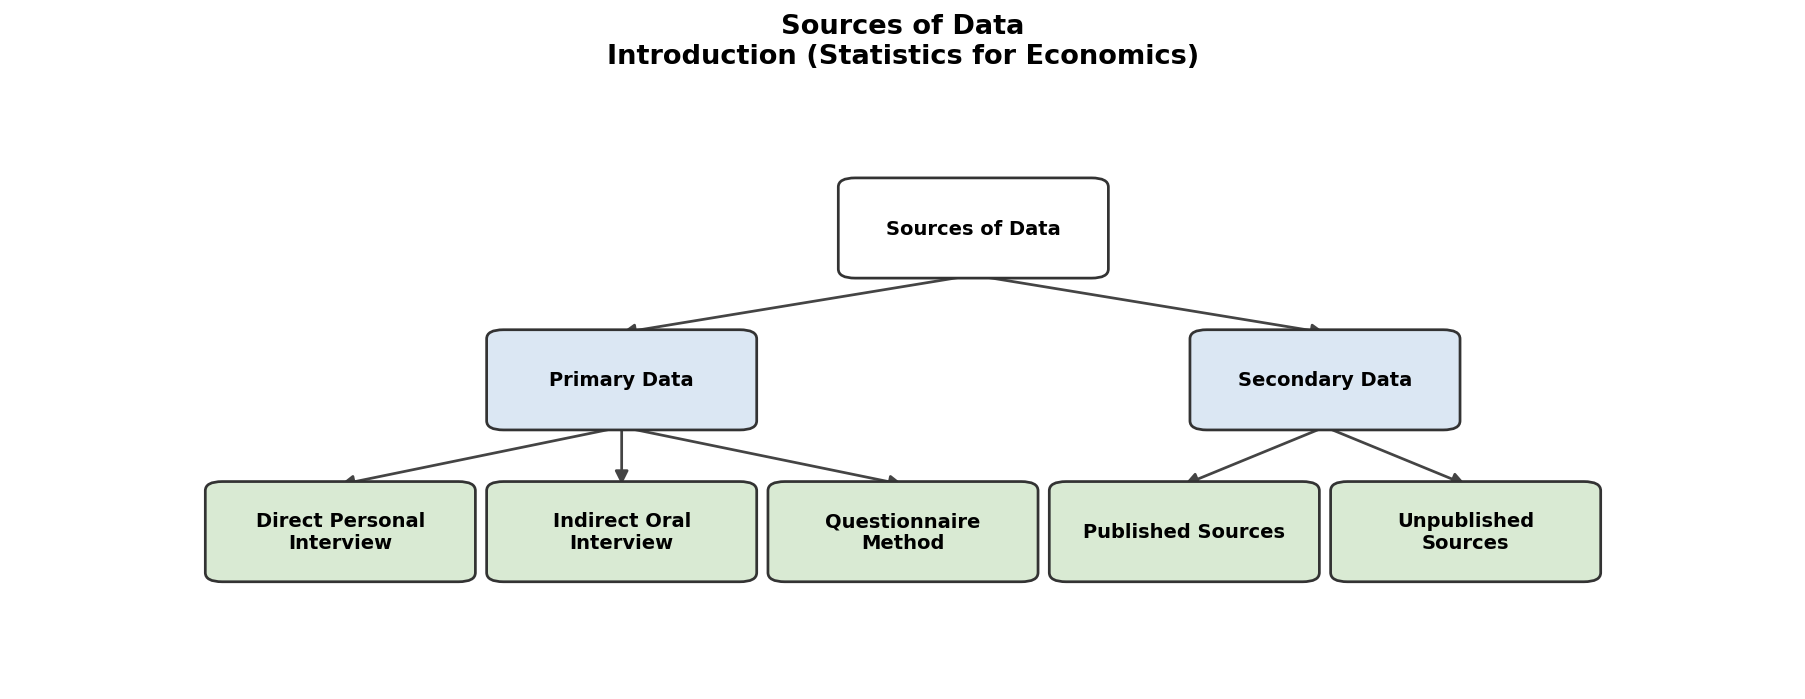
2. Primary Data is the data collected for the first time by the investigator himself for a specific purpose. It is original in nature and has not been used before.
3. Option 3 — Questionnaire Method
4. Secondary Data is less time-consuming and less expensive to collect as it has already been gathered by someone else, making it more convenient for the researcher.
5. Option 2 — It provides numerical data to help planners make informed decisions
6. Statistics helps in policy formulation by providing quantitative evidence on economic issues. For example, data on unemployment rates helps the government design employment generation schemes like MGNREGA.
7. Option 3 — Establishes Relationships
8. Presenting facts in a definite numerical form makes them precise, clear, and convincing. Vague statements like 'many people are poor' are less useful than specific data like '22% of the population lives below the poverty line', which aids in better analysis and decision-making.
9. Option 3 — It does not study individuals
10. Statistics can be misused by presenting data selectively to support a biased conclusion. For example, a company may advertise that its product is used by '9 out of 10 doctors' without revealing that the survey was conducted on only 10 doctors, making the result misleading.
11. Option 2 — Statistics is used in economics, business, and planning
12. Statistical results represent the average tendency of a group and may not apply to every individual. For example, if the average income of a village is ₹10,000 per month, it does not mean every person earns exactly ₹10,000 — some may earn much more and others much less. Thus, statistical conclusions are approximate and not universally applicable.
13. Primary Data is collected for the first time by the investigator himself for a specific purpose, whereas Secondary Data is data that has already been collected and published or unpublished by some other agency or person.
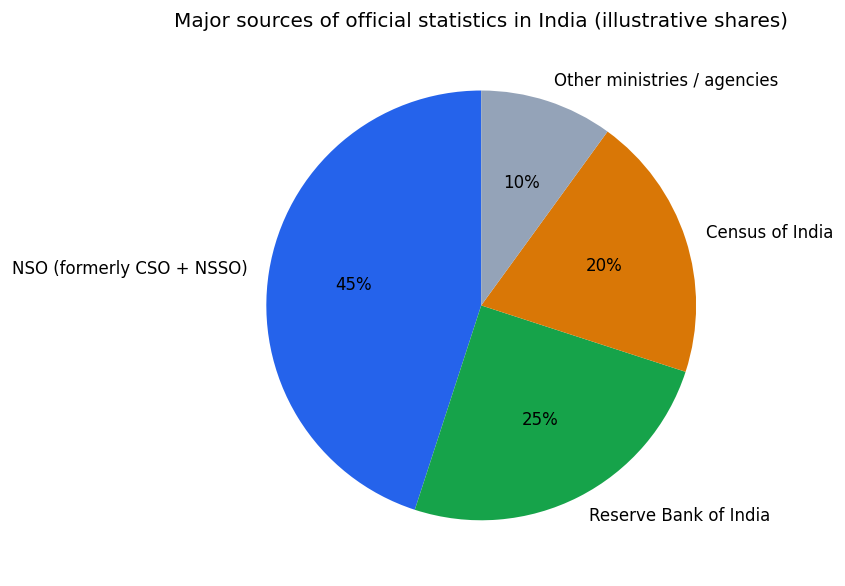
14. Option 2 — Census of India reports
15. Option 3 — Helps in Policy Formulation
16. Statistics helps in economic planning by providing quantitative data about resources, production, consumption, and population. For example, the government uses statistical data on poverty levels and income distribution to plan welfare schemes and allocate budgets effectively.
17. Option 2 — Predicting future trends based on past data
18. Presenting facts in a definite numerical form makes information precise, objective, and verifiable. Vague statements like 'many people are poor' are less useful than specific data like '22% of India's population lives below the poverty line', which allows for accurate analysis and decision-making.
19. Option 3 — Studies only Quantitative Facts
20. Statistics can be misused by selectively presenting data to support a biased conclusion. For example, if a company's profit rose from Rs. 1 lakh to Rs. 2 lakh, it could claim a '100% increase in profit', which sounds impressive but may hide the fact that the absolute profit is still very small. Such selective use of data misleads the audience.
21. Option 2 — Statistics deals with aggregates and not individual data points in isolation
22. Homogeneity of data is necessary because statistical comparisons are valid only when the data being compared belongs to the same category or type. If data is not homogeneous (e.g., comparing the wages of doctors with those of daily wage labourers), the results will be misleading and conclusions drawn will be incorrect and unreliable.