Skip to content
TestMacher
Chapter 2 · Class 11 Economics

Correlation (Statistics for Economics) — Important Questions

59 questions With answers CBSE format

SUMMARY: The chapter on Correlation in Class 11 Economics focuses on understanding the statistical measure that describes the degree to which two variables move in relation to each other.
KEY TOPICS: correlation coefficient, positive correlation, negative correlation, zero correlation, scatter diagram, Karl Pearson's method, Spearman's rank correlation, properties of correlation, interpretation of correlation, limitations of correlation

Q1 1 Mark

The value of Karl Pearson's correlation coefficient always lies between:

A0 and 1
B−1 and 0
C−1 and +1
D0 and ∞
Check answerHide answer
Correct answer: Option 3 — −1 and +1
Q2 1 Mark

A correlation coefficient of −1 indicates:

ANo correlation
BPerfect positive correlation
CPerfect negative correlation
DModerate negative correlation
Check answerHide answer
Correct answer: Option 3 — Perfect negative correlation
Q3 1 Mark

Spearman's rank correlation is most useful when:

AThe data are strictly quantitative
BThe data are qualitative or ranked
CThere is a non-linear relationship only
DThe data are censused
Check answerHide answer
Correct answer: Option 2 — The data are qualitative or ranked
Q4 1 Mark

In a scatter diagram all points lying on a straight upward-sloping line indicate:

ANo correlation
BPerfect positive correlation
CPerfect negative correlation
DWeak correlation
Check answerHide answer
Correct answer: Option 2 — Perfect positive correlation
Q5 1 Mark

Correlation does NOT imply:

AAssociation between variables
BCausation between variables
CDirection of association
DStrength of relationship
Check answerHide answer
Correct answer: Option 2 — Causation between variables
Q6 1 Mark

Which of the following values of correlation coefficient indicates a perfect positive correlation?

A0
B-1
C+1
D+0.5
Check answerHide answer
Correct answer: Option 3 — +1
Q7 1 Mark

When two variables move in opposite directions, the correlation between them is called:

AZero correlation
BPositive correlation
CPartial correlation
DNegative correlation
Check answerHide answer
Correct answer: Option 4 — Negative correlation
Q8 1 Mark

A scatter diagram in which all points lie on a straight line sloping downward from left to right indicates:

APerfect positive correlation
BZero correlation
CPerfect negative correlation
DModerate positive correlation
Check answerHide answer
Correct answer: Option 3 — Perfect negative correlation
Q9 1 Mark

Karl Pearson's coefficient of correlation is also known as:

ARank correlation coefficient
BProduct moment correlation coefficient
CConcurrent deviation coefficient
DScatter coefficient
Check answerHide answer
Correct answer: Option 2 — Product moment correlation coefficient
Q10 1 Mark

If the correlation coefficient between two variables X and Y is +0.8, what does this indicate?

AX and Y are perfectly correlated
BX and Y have a strong negative relationship
CX and Y have a strong positive relationship
DX and Y are not related at all
Check answerHide answer
Correct answer: Option 3 — X and Y have a strong positive relationship
Q11 1 Mark

Spearman's rank correlation coefficient is most appropriately used when:

AData is available in quantitative form only
BData is available in the form of ranks or qualitative attributes
CThe number of observations is very large
DBoth variables follow a normal distribution
Check answerHide answer
Correct answer: Option 2 — Data is available in the form of ranks or qualitative attributes
Q12 1 Mark

The formula for Spearman's rank correlation coefficient is r = 1 - [6ΣD²/n(n²-1)]. What does 'D' represent in this formula?

ADifference between actual values of X and Y
BDeviation of X from its mean
CDifference between the ranks assigned to corresponding values of X and Y
DSum of all deviations
Check answerHide answer
Correct answer: Option 3 — Difference between the ranks assigned to corresponding values of X and Y
Q13 1 Mark

Which of the following is a limitation of using correlation analysis?

AIt can only measure positive relationships
BCorrelation does not imply causation between two variables
CIt cannot be used for economic data
DIt requires data to be in ranked form only
Check answerHide answer
Correct answer: Option 2 — Correlation does not imply causation between two variables
Q14 1 Mark

If ΣD² = 0 in Spearman's rank correlation formula, the value of the rank correlation coefficient will be:

A-1
B0
C0.5
D+1
Check answerHide answer
Correct answer: Option 4 — +1
Q15 1 Mark

For two variables X and Y, if the deviations from their respective means are dx and dy, Karl Pearson's correlation coefficient r is given by which of the following expressions?

Ar = Σdx·dy / (N · σx · σy)
Br = Σdx·dy / (σx + σy)
Cr = (Σdx + Σdy) / (N · σx · σy)
Dr = Σdx·dy / (N + σx · σy)
Check answerHide answer
Correct answer: Option 1 — r = Σdx·dy / (N · σx · σy)
Q16 3 Marks

Define correlation and distinguish between positive and negative correlation.

View sample solutionHide solution
Correlation measures the degree and direction of association between two variables. Positive correlation: both variables move in the same direction (e.g. income and consumption). Negative correlation: they move in opposite directions (e.g. price and quantity demanded). The correlation coefficient r captures both direction (sign) and strength (magnitude).
Q17 3 Marks

State the range within which Karl Pearson's correlation coefficient lies.

View sample solutionHide solution
Karl Pearson's correlation coefficient r lies between −1 and +1 (inclusive). r = +1 denotes perfect positive linear correlation; r = −1 denotes perfect negative linear correlation; r = 0 indicates no linear relationship. Values close to ±1 indicate strong association; values close to 0 indicate weak association.
Q18 3 Marks

What is a scatter diagram and what does it show?

View sample solutionHide solution
A scatter diagram is a simple graphical method that plots paired values of two variables as points on an X-Y plane. The pattern of the dots indicates the nature of correlation: an upward band suggests positive correlation, a downward band negative, and a cloud with no pattern little or no correlation. It is quick but non-quantitative.
Q19 3 Marks

What is Spearman's rank correlation?

View sample solutionHide solution
Spearman's rank correlation measures the correlation between ranks (rather than raw values) of two variables. It is given by r = 1 − [6 Σ d² / N(N² − 1)], where d is the rank difference for each pair. It is especially useful when data are qualitative (e.g. intelligence, beauty) or when the distribution has extreme values.
Q20 3 Marks

Why does 'correlation not imply causation'?

View sample solutionHide solution
Two variables can move together for reasons other than one causing the other — e.g. both may be influenced by a third factor, or the relationship may be mere coincidence. Before concluding causation, one must examine the theoretical mechanism, use controlled experiments where possible, and rule out common influences.
Q21 3 Marks

Define correlation and state its significance in statistical analysis.

View sample solutionHide solution
Correlation is a statistical measure that describes the degree and direction of relationship between two variables. It helps in understanding how changes in one variable are associated with changes in another variable. Its significance lies in predicting the value of one variable when the value of the other is known.
Q22 3 Marks

What is a scatter diagram? How is it useful in studying correlation?

View sample solutionHide solution
A scatter diagram is a graphical method of studying correlation where values of two variables are plotted as dots on a graph. The pattern formed by these dots indicates the nature and degree of correlation between the variables. If the dots cluster along a rising line, it shows positive correlation, and along a falling line, it shows negative correlation.
Q23 3 Marks

Distinguish between positive correlation and negative correlation with one example each.

View sample solutionHide solution
Positive correlation exists when two variables move in the same direction, i.e., when one increases the other also increases. For example, income and expenditure are positively correlated. Negative correlation exists when two variables move in opposite directions, i.e., when one increases the other decreases. For example, price and demand are negatively correlated.
Q24 3 Marks

What is zero correlation? Give an example.

View sample solutionHide solution
Zero correlation means there is no relationship between the two variables, and changes in one variable do not affect the other variable at all. The correlation coefficient in this case is equal to zero. For example, the relationship between a person's shoe size and their intelligence shows zero correlation.
Q25 3 Marks

State any two important properties of the correlation coefficient.

View sample solutionHide solution
First, the value of the correlation coefficient always lies between -1 and +1, i.e., -1 ≤ r ≤ +1. Second, the correlation coefficient is a pure number and is independent of the units of measurement of the variables. A value of +1 indicates perfect positive correlation and -1 indicates perfect negative correlation.
Q26 6 Marks

Explain different methods of studying correlation.

View sample solutionHide solution
(1) Scatter diagram — a quick graphical method; pairs of values are plotted on the X-Y plane, and the shape of the cloud suggests the direction and strength of correlation. Simple and intuitive but non-numerical. (2) Karl Pearson's coefficient of correlation (r) — the standard algebraic measure; r = Σxy / √(Σx² · Σy²) where x = X − ¯X, y = Y − ¯Y. r lies in [−1, +1]; best for linear relationships with quantitative data. (3) Spearman's rank correlation — uses ranks of observations; r = 1 − 6Σd² / N(N² − 1); suitable for qualitative data, ranked data, or when extreme values distort Pearson's r. (4) Concurrent deviations method — counts the proportion of pairs in which both variables move in the same direction; gives a rough quick estimate. Choice depends on the nature of data and purpose.
Q27 6 Marks

Compute Karl Pearson's coefficient of correlation for the following data: X = 2, 4, 6, 8, 10; Y = 3, 7, 5, 13, 12.

View sample solutionHide solution
¯X = 30/5 = 6; ¯Y = 40/5 = 8. Compute deviations x = X − ¯X and y = Y − ¯Y. x: −4, −2, 0, 2, 4. y: −5, −1, −3, 5, 4. xy: 20, 2, 0, 10, 16 → Σxy = 48. x²: 16, 4, 0, 4, 16 → Σx² = 40. y²: 25, 1, 9, 25, 16 → Σy² = 76. r = Σxy / √(Σx² · Σy²) = 48 / √(40 × 76) = 48 / √3040 ≈ 48 / 55.14 ≈ 0.87. The correlation coefficient is about +0.87, indicating a strong positive linear relationship between X and Y.
Q28 6 Marks

Distinguish between correlation and causation with an economic example.

View sample solutionHide solution
Correlation measures the extent to which two variables move together; causation implies that one variable's change actually produces a change in the other. Correlation does not imply causation — observed association may arise from (a) a common third cause, (b) pure coincidence, (c) indirect or spurious relationships. Example: the number of ice-cream sales and the number of drowning incidents are positively correlated — but one does not cause the other; both are driven by a third factor, hot summer weather. In economics, the fact that higher education and higher income are correlated does not by itself prove that education causes higher income — innate ability, family background and networks may be responsible. Causation can be established only through theory, controlled experiments where possible, and sophisticated statistical techniques (regression with controls, natural experiments, etc.).
Q29 6 Marks

Compute Spearman's rank correlation coefficient for the following marks of 5 students in two subjects: Eco: 85, 70, 60, 52, 90; Stats: 88, 65, 70, 55, 92.

View sample solutionHide solution
Rank Eco (highest = 1): 90 → 1, 85 → 2, 70 → 3, 60 → 4, 52 → 5. Rank Stats: 92 → 1, 88 → 2, 70 → 3, 65 → 4, 55 → 5. Pair up and compute d = R1 − R2. Student values with ranks (Eco, Stats): (2,2), (3,4), (4,3), (5,5), (1,1). d: 0, −1, 1, 0, 0. d²: 0, 1, 1, 0, 0 → Σd² = 2. N = 5. r = 1 − [6 Σ d² / N(N² − 1)] = 1 − [6 × 2 / 5 × 24] = 1 − 12/120 = 1 − 0.1 = 0.9. Spearman's rank correlation coefficient = +0.9, indicating very strong agreement between ranks in Economics and Statistics.
Q30 6 Marks

Explain the types of correlation based on the direction and shape of the relationship.

View sample solutionHide solution
(1) Positive correlation — both variables move in the same direction; r > 0. Example: income and consumption. (2) Negative correlation — variables move in opposite directions; r < 0. Example: price and quantity demanded (law of demand). (3) Perfect correlation — all points lie on a single straight line; r = +1 or −1. (4) No correlation — r ≈ 0; variables are unrelated (or only non-linearly related). (5) Linear correlation — relationship can be represented by a straight line; Pearson's r is appropriate. (6) Non-linear correlation — relationship follows a curve (e.g. U-shaped, quadratic); Pearson's r underestimates the association and Spearman's rank correlation or transformations may be better. Identifying the type guides the choice of measure and the economic interpretation.
Q31 6 Marks

Compare positive and negative correlation with the help of a table giving examples.

Q32 1 Mark

Assertion (A): Karl Pearson's correlation coefficient lies between −1 and +1.

Reason (R): It is a normalised measure of the linear association between two quantitative variables.

Show explanationHide explanation
Correct answer: Option 1 — Both A and R are true, and R is the correct explanation of A.
Q33 1 Mark

Assertion (A): A high correlation between two variables does not prove that one causes the other.

Reason (R): A common third factor, or coincidence, can produce correlation without any underlying causal link.

Show explanationHide explanation
Correct answer: Option 1 — Both A and R are true, and R is the correct explanation of A.
Q34 1 Mark

Assertion (A): Spearman's rank correlation is suitable for qualitative data.

Reason (R): It uses ranks instead of actual values, which makes it applicable when data can be ordered but not precisely measured.

Show explanationHide explanation
Correct answer: Option 1 — Both A and R are true, and R is the correct explanation of A.
Q35 1 Mark

Assertion (A): A scatter diagram indicates the direction of correlation.

Reason (R): Points trending upward from left to right suggest positive correlation, while downward points suggest negative correlation.

Show explanationHide explanation
Correct answer: Option 1 — Both A and R are true, and R is the correct explanation of A.
Q36 1 Mark

Assertion (A): Zero correlation means the two variables are completely unrelated.

Reason (R): Karl Pearson's coefficient is zero when there is no linear association between the two variables.

Show explanationHide explanation
Correct answer: Option 2 — Both A and R are true, but R is not the correct explanation of A.
Q37 1 Mark

Assertion (A): Correlation coefficient always lies between -1 and +1.

Reason (R): The correlation coefficient measures the strength and direction of the linear relationship between two variables and is bounded by these limits.

Show explanationHide explanation
Correct answer: Option 1 — Both A and R are true, and R is the correct explanation of A.
Q38 1 Mark

Assertion (A): A scatter diagram where all points lie on a straight line sloping downward indicates perfect negative correlation.

Reason (R): When all plotted points fall exactly on a downward sloping straight line, the correlation coefficient equals -1.

Show explanationHide explanation
Correct answer: Option 1 — Both A and R are true, and R is the correct explanation of A.
Q39 1 Mark

Assertion (A): Karl Pearson's coefficient of correlation is also known as the product moment correlation coefficient.

Reason (R): Spearman's rank correlation is based on the ranks of observations rather than their actual values.

Show explanationHide explanation
Correct answer: Option 2 — Both A and R are true, but R is not the correct explanation of A.
Q40 1 Mark

Statement 1: Correlation measures the degree of association between two variables.

Statement 2: Regression quantifies how one variable is predicted from another.

Show answerHide answer
Correct answer: Option 1 — Both statements are true.
Q41 1 Mark

Statement 1: Karl Pearson's coefficient assumes a linear relationship between variables.

Statement 2: It can be influenced by extreme values in the data.

Show answerHide answer
Correct answer: Option 1 — Both statements are true.
Q42 1 Mark

Statement 1: Rank correlation was developed by Spearman.

Statement 2: Product-moment correlation was developed by Karl Pearson.

Show answerHide answer
Correct answer: Option 1 — Both statements are true.
Q43 1 Mark

Statement 1: Correlation can be positive or negative.

Statement 2: The sign of the correlation coefficient shows the direction of the association.

Show answerHide answer
Correct answer: Option 1 — Both statements are true.
Q44 1 Mark

Statement 1: A scatter diagram is a graphical method for assessing correlation.

Statement 2: It provides a visual idea of the direction and the approximate strength of the association.

Show answerHide answer
Correct answer: Option 1 — Both statements are true.
Q45 1 Mark

Statement 1: Correlation coefficient measures the degree and direction of linear relationship between two variables.

Statement 2: A correlation coefficient value of +1 indicates a perfect positive correlation between two variables.

Show answerHide answer
Correct answer: Option 1 — Both statements are true.
Q46 1 Mark

Statement 1: In a scatter diagram, when points are scattered randomly without any pattern, it indicates zero correlation.

Statement 2: A scatter diagram can only show positive correlation between two variables.

Show answerHide answer
Correct answer: Option 2 — Only Statement 1 is true.
Q47 1 Mark

Statement 1: Negative correlation means that as one variable increases, the other variable also increases.

Statement 2: The relationship between price and demand is a classic example of negative correlation.

Show answerHide answer
Correct answer: Option 3 — Only Statement 2 is true.
Q48 3 Marks
An economist studies the relationship between family income and family expenditure for 10 households. A scatter diagram shows points lying close to an upward-sloping straight line.
  1. The correlation between income and expenditure is:
    APositive
    BNegative
    CZero
    DIndeterminate
  2. The value of Karl Pearson's r here would be:
    AClose to −1
    BClose to 0
    CClose to +1
    DUndefined
  3. Interpret the scatter and mention one economic theory that predicts it.
Show answersHide answers
1. Option 1 — Positive
2. Option 3 — Close to +1
3. The upward-sloping cloud of points indicates that higher income is associated with higher expenditure, i.e. positive correlation. Since the points lie very close to the line, the correlation is strong — |r| close to 1. Theoretically, Engel's law explains this: expenditure rises with income but usually by less than proportionately.
Q49 3 Marks
A firm studies the effect of advertising spend (X) on its cost per sale (Y) over 12 months. Plotting the pairs on a scatter diagram produces a downward-sloping cloud of points.
  1. The correlation between advertising spend and cost per sale is:
    APositive
    BNegative
    CZero
    DIndeterminate
  2. A higher advertising spend is associated with _____ cost per sale, i.e. a _____ correlation.
    APositive
    BNegative
    CNo
    DPerfect
  3. Explain why negative correlation does not by itself establish causation.
Show answersHide answers
1. Option 2 — Negative
2. Option 2 — Negative
3. A downward-sloping cloud indicates negative correlation — cost per sale falls as advertising rises. But correlation does not prove causation: both may be driven by a scale factor (e.g. larger campaigns reach more customers, diluting per-sale costs). A carefully designed experiment with controls is needed to establish causation.
Q50 3 Marks
Two judges rank 5 contestants at a debate competition. Their rankings are: Judge A — 1, 2, 3, 4, 5; Judge B — 2, 1, 3, 5, 4.
  1. Using Spearman's formula r = 1 − 6Σd² / N(N² − 1), what is approximately r?
    A0.0
    B0.5
    C0.9
    D1.0
  2. Spearman's rank correlation is appropriate when the data are:
    AQuantitative
    BRanked / qualitative
    CContinuous
    DNominal
  3. Compute the Spearman rank correlation and interpret it.
Show answersHide answers
1. Option 3 — 0.9
2. Option 2 — Ranked / qualitative
3. d values: −1, 1, 0, −1, 1. d²: 1, 1, 0, 1, 1 — Σd² = 4. N = 5. r = 1 − (6 × 4) / (5 × 24) = 1 − 24/120 = 1 − 0.2 = 0.8. So the judges' rankings are positively and strongly correlated; they broadly agree on the order of contestants.
Q51 4 Marks
A statistics teacher asked her Class 11 students to study the relationship between the number of hours studied per day and the marks obtained in the economics exam. She collected data from 10 students and plotted a scatter diagram. The scatter diagram showed that as the number of hours of study increased, the marks also increased consistently. All the points on the scatter diagram were close to an upward-sloping straight line. The teacher explained that this is a classic example of a strong positive correlation. She further told the students that correlation is a statistical tool that measures the degree and direction of the linear relationship between two variables. The value of the correlation coefficient ranges from -1 to +1, and the closer it is to +1, the stronger the positive relationship between the two variables.
  1. What does a scatter diagram showing points close to an upward-sloping straight line indicate?
    AStrong negative correlation
    BZero correlation
    CStrong positive correlation
    DNo relationship between variables
  2. The value of the correlation coefficient always lies between:
    A0 and 1
    B-1 and 0
    C-1 and +1
    D-2 and +2
  3. Define correlation and state the significance of using a scatter diagram in studying correlation.
  4. If the correlation coefficient between hours studied and marks obtained is +0.95, what can we conclude?
Show answersHide answers
1. Option 3 — Strong positive correlation
2. Option 3 — -1 and +1
3. Correlation is a statistical measure that describes the degree and direction of the linear relationship between two variables. A scatter diagram is significant because it provides a visual representation of the data, allowing us to quickly identify whether the relationship between two variables is positive, negative, or zero, and whether it is strong or weak, without performing complex calculations.
4. A correlation coefficient of +0.95 indicates a very strong positive correlation between hours studied and marks obtained. This means that as the number of hours studied increases, the marks obtained also increase significantly. The relationship is close to perfect positive correlation (which would be +1).
Q52 3 Marks

Study the paired data and answer:

XY
23
47
65
813
1012
  1. Karl Pearson's correlation coefficient for the data is approximately:
    A+1.00
    B+0.87
    C+0.50
    D0.00
  2. The direction of correlation is:
    APositive
    BNegative
    CZero
    DPerfect
  3. Show the calculation for Pearson's r.
Show answersHide answers
1. Option 2 — +0.87
2. Option 1 — Positive
3. ¯X = 6, ¯Y = 8. Deviations x: −4, −2, 0, 2, 4; y: −5, −1, −3, 5, 4. Σxy = 48; Σx² = 40; Σy² = 76. r = 48 / √(40 × 76) = 48 / √3040 ≈ 48 / 55.14 ≈ 0.87. A strong positive correlation of +0.87 suggests X and Y move together, but not perfectly (r = 1 would be perfect).
Q53 3 Marks

Study the correlation interpretation guide and answer:

r rangeInterpretation
0.9 - 1.0Very strong positive
0.7 - 0.9Strong positive
0.4 - 0.7Moderate positive
0.0 - 0.4Weak
NegativeSame magnitudes with opposite sign
  1. An r of 0.95 indicates:
    AVery strong positive
    BStrong positive
    CModerate positive
    DWeak positive
  2. An r of −0.8 indicates:
    AWeak positive
    BModerate positive
    CStrong positive
    DStrong negative
  3. Why should the r value be interpreted in the context of the subject matter?
Show answersHide answers
1. Option 1 — Very strong positive
2. Option 4 — Strong negative
3. The sign of r tells the direction (positive or negative) and the absolute value tells the strength. Weak correlation (|r| < 0.4) often reflects a noisy relationship or the influence of other variables. No single threshold is universal — the 'strong' cut-off depends on context.
Q54 6 Marks

Calculate Karl Pearson's correlation coefficient between price (X) and quantity demanded (Y).

Price (₹)Quantity demanded
1050
2045
3035
4025
5015
Q55 6 Marks

Compute Spearman's rank correlation coefficient between the two judges' rankings.

ContestantJudge A rankJudge B rank
P12
Q21
R33
S45
T54
Q56 3 Marks

Study the scatter diagram of income and consumption and answer:

Correlation (Statistics for Economics) figure
  1. The correlation between income and consumption here is:
    APerfect positive
    BStrong positive
    CStrong negative
    DZero
  2. The Karl Pearson correlation coefficient (r) would be:
    AClose to +1
    BClose to −1
    CExactly zero
    DGreater than +1
  3. How does the scatter diagram reveal both direction and strength of correlation?
Show answersHide answers
1. Option 2 — Strong positive
2. Option 1 — Close to +1
3. A scatter diagram gives a quick visual assessment of both the direction and the strength of correlation — an upward-sloping cloud suggests positive correlation; a compact cloud suggests strong correlation. Adding a best-fit line summarises the average relationship.
Q57 8 Marks

Based on the given scatter diagram, answer the following:

Correlation (Statistics for Economics) figure
  1. What type of correlation is shown in the scatter diagram between hours studied and marks obtained?
    ANegative correlation
    BZero correlation
    CPositive correlation
    DNo relationship
  2. In the scatter diagram, the points are closely clustered around an imaginary upward-sloping line. What does this indicate about the degree of correlation?
    AWeak positive correlation
    BPerfect negative correlation
    CZero correlation
    DStrong positive correlation
  3. What would the scatter diagram look like if there were a perfect positive correlation between hours studied and marks obtained? Explain briefly.
  4. A student concludes that because hours studied and marks obtained are positively correlated, studying more hours always causes higher marks. Is this conclusion correct? Give one reason.
  5. What type of correlation is shown in the scatter diagram between study hours and marks obtained?
    ANegative Correlation
    BZero Correlation
    CPositive Correlation
    DNo relationship
  6. In a scatter diagram, if all the plotted points lie on a straight line rising from the lower left to the upper right corner, what does it indicate?
    AZero correlation
    BPerfect negative correlation
    CModerate positive correlation
    DPerfect positive correlation
  7. What is the range of the Karl Pearson's correlation coefficient (r)? What would be the approximate value of r for the data shown in this scatter diagram?
  8. State one limitation of using a scatter diagram as a method of measuring correlation.
  9. What type of correlation is shown in the scatter diagram above?
    ANegative Correlation
    BZero Correlation
    CPositive Correlation
    DNo relationship
  10. In a scatter diagram, what does each dot represent?
    AA statistical formula
    BA pair of values of two variables
    CThe mean of the data
    DThe standard deviation
  11. Approximately, what is the range of marks obtained when study hours are between 4 and 6?
  12. What would happen to the scatter diagram if the correlation between the two variables were zero?
Show answersHide answers
1. Option 3 — Positive correlation
2. Option 4 — Strong positive correlation
3. In the case of a perfect positive correlation (r = +1), all the plotted points in the scatter diagram would lie exactly on a straight line that slopes upward from left to right. There would be no deviation of any point from this line.
4. No, this conclusion is not entirely correct. Correlation only measures the degree and direction of the relationship between two variables; it does not establish causation. The positive correlation may be due to other factors (e.g., quality of study, intelligence), and correlation alone cannot prove that one variable causes the other.
5. Option 3 — Positive Correlation
6. Option 4 — Perfect positive correlation
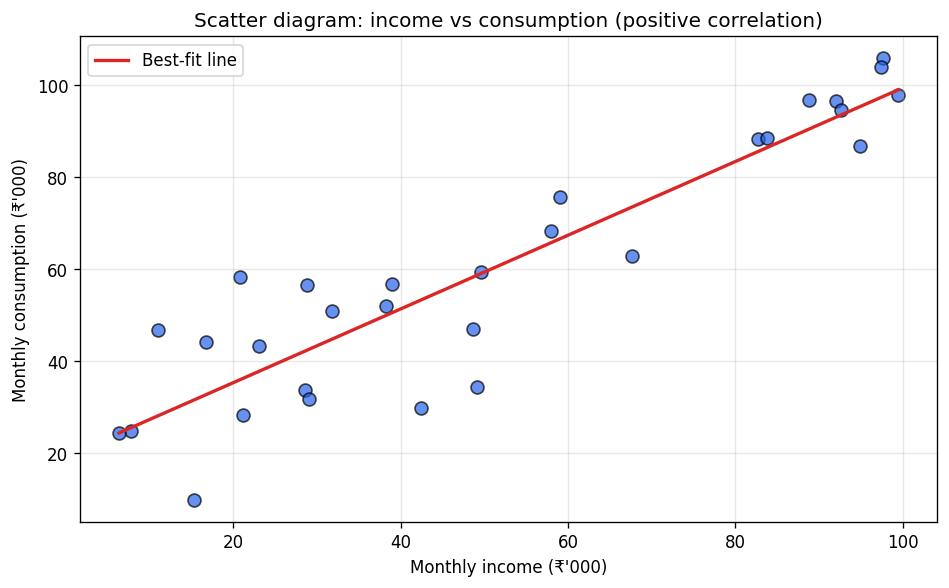
7. The Karl Pearson's correlation coefficient (r) ranges from -1 to +1 (i.e., -1 ≤ r ≤ +1). For the data shown in this scatter diagram, since the points are closely clustered along an upward-rising line, the value of r would be approximately close to +1, indicating a strong positive correlation.
8. A scatter diagram can only indicate the direction and approximate degree of correlation visually. It does not give an exact numerical value of the correlation coefficient, making it difficult to precisely quantify the strength of the relationship between two variables.
9. Option 3 — Positive Correlation
10. Option 2 — A pair of values of two variables
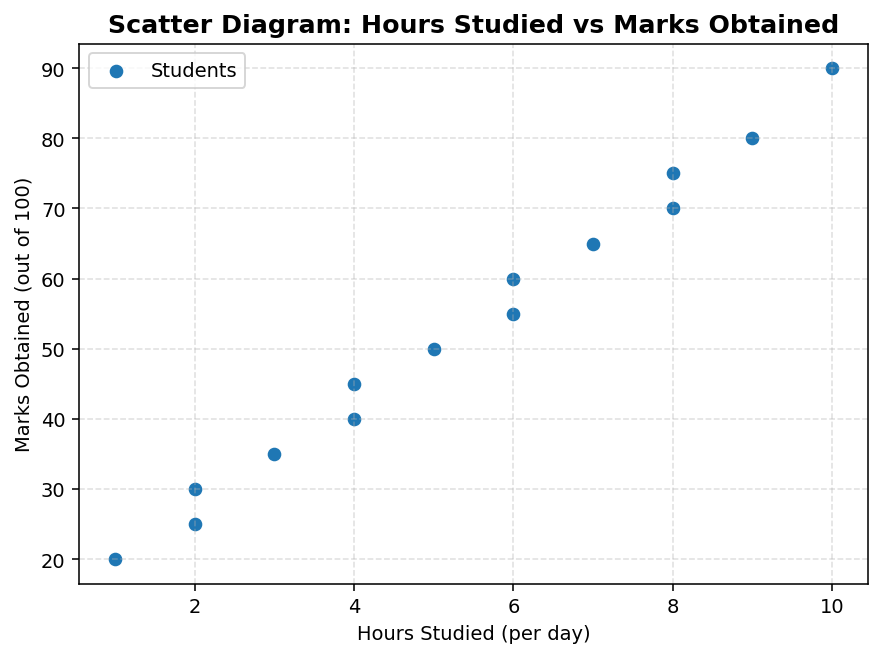
11. When study hours are between 4 and 6, the marks obtained range approximately from 35 to 50.
12. If the correlation were zero, the dots in the scatter diagram would be randomly scattered with no discernible pattern or direction, indicating no linear relationship between the two variables.
Q58 4 Marks

Based on the given scatter diagram showing the relationship between advertising expenditure and sales revenue of a company, answer the following:

Correlation (Statistics for Economics) figure
  1. What type of correlation does the scatter diagram depict between advertising expenditure and sales revenue?
    APerfect positive correlation
    BNegative correlation
    CZero correlation
    DPositive correlation
  2. Which of the following values of Karl Pearson's correlation coefficient (r) is most likely to represent the relationship shown in the scatter diagram?
    Ar = +0.95
    Br = 0
    Cr = -0.90
    Dr = +0.50
  3. What does a zero correlation (r = 0) look like on a scatter diagram? How is it different from what is shown in this diagram?
  4. State one limitation of using a scatter diagram to measure correlation.
    AIt can only show positive correlation
    BIt gives an exact numerical value of the correlation coefficient
    CIt does not provide a precise numerical measure of the degree of correlation
    DIt cannot be used for more than five data points
Show answersHide answers
1. Option 2 — Negative correlation
2. Option 3 — r = -0.90
3. A zero correlation (r = 0) on a scatter diagram appears as randomly scattered points with no discernible pattern or direction — the points are spread all over without forming any upward or downward trend. In contrast, the given diagram shows points clearly sloping downward from left to right, indicating a strong negative correlation, which is very different from a zero correlation.
4. Option 3 — It does not provide a precise numerical measure of the degree of correlation
Q59 4 Marks

Based on the given diagram showing the classification of types of correlation, answer the following:

Correlation (Statistics for Economics) figure
  1. According to the diagram, which type of correlation exists when two variables move in opposite directions?
    APositive Correlation
    BZero Correlation
    CNegative Correlation
    DLinear Correlation
  2. Which of the following is the correct value of the correlation coefficient when there is zero correlation between two variables?
    Ar = +1
    Br = -1
    Cr = 0
    Dr = 0.5
  3. Distinguish between Linear Correlation and Non-Linear Correlation as shown in the diagram.
  4. Give one real-life example each of Positive Correlation and Negative Correlation as classified in the diagram.
Show answersHide answers
1. Option 3 — Negative Correlation
2. Option 3 — r = 0
3. Linear Correlation: When the ratio of change between two variables is constant and the plotted points on a scatter diagram tend to lie along a straight line, the correlation is called linear. For example, if X doubles and Y also doubles consistently. Non-Linear (Curvilinear) Correlation: When the ratio of change between two variables is not constant and the plotted points on a scatter diagram form a curve rather than a straight line, the correlation is called non-linear or curvilinear.
4. Positive Correlation Example: The relationship between income and expenditure — as income increases, expenditure also tends to increase. Both variables move in the same direction. Negative Correlation Example: The relationship between price of a commodity and its demand — as the price increases, the demand decreases. Both variables move in opposite directions.

Make a full Economics paper on Correlation (Statistics for Economics).

Pick the question mix, set the marks, hit generate. You get a ready-to-print paper with an answer key.

Generate your paper — free