Organisation of Data (Statistics for Economics) — Important Questions
59 questions
With answersCBSE format
SUMMARY: The chapter "Organisation of Data" in Class 11 Economics focuses on the systematic arrangement and presentation of data for analysis and interpretation in statistics. KEY TOPICS: data classification, frequency distribution, tabulation, types of data, qualitative and quantitative data, discrete and continuous data, cumulative frequency distribution, graphical representation of data, bar diagrams, pie charts
Which of the following best describes 'classification of data'?
APresenting data in graphical form
BArranging data into groups or classes based on similarities
CCollecting data from primary sources
DCalculating averages from raw data
Check answerHide answer
Correct answer: Option 2 — Arranging data into groups or classes based on similarities
Q71 Mark
Data that can take any value within a given range is called:
ADiscrete data
BQualitative data
CContinuous data
DNominal data
Check answerHide answer
Correct answer: Option 3 — Continuous data
Q81 Mark
The number of students scoring marks in the range 40–50 in a class test is an example of:
ACumulative frequency
BClass frequency
CRelative frequency
DAbsolute deviation
Check answerHide answer
Correct answer: Option 2 — Class frequency
Q91 Mark
In a frequency distribution, the class interval 20–30 has a lower class limit of:
A30
B25
C10
D20
Check answerHide answer
Correct answer: Option 4 — 20
Q101 Mark
Which of the following is an example of qualitative (or categorical) data?
AHeight of students in centimetres
BNumber of cars sold per month
CReligion of individuals in a survey
DTemperature recorded daily
Check answerHide answer
Correct answer: Option 3 — Religion of individuals in a survey
Q111 Mark
Cumulative frequency of a class interval is obtained by:
ASubtracting the frequency of the previous class from the current class
BAdding all frequencies up to and including that class interval
CDividing the class frequency by the total frequency
DMultiplying the class frequency by the class width
Check answerHide answer
Correct answer: Option 2 — Adding all frequencies up to and including that class interval
Q121 Mark
A frequency distribution in which class intervals do not overlap and each observation belongs to exactly one class is called:
AInclusive series
BOpen-end series
CExclusive series
DCumulative series
Check answerHide answer
Correct answer: Option 3 — Exclusive series
Q131 Mark
If the class intervals are 0–10, 10–20, 20–30, the mid-value (class mark) of the class 10–20 is:
A10
B20
C15
D25
Check answerHide answer
Correct answer: Option 3 — 15
Q141 Mark
In a 'less than' cumulative frequency distribution, the cumulative frequency against the class 0–10 in the following data is: Class: 0–10 (f=5), 10–20 (f=8), 20–30 (f=12). What is the cumulative frequency for 'less than 20'?
A8
B13
C25
D5
Check answerHide answer
Correct answer: Option 2 — 13
Q151 Mark
A frequency distribution table shows the following: Class 10–20 has frequency 6, class 20–30 has frequency 10, class 30–40 has frequency 4. The relative frequency of the class 20–30 is:
A0.25
B0.60
C0.50
D0.40
Check answerHide answer
Correct answer: Option 3 — 0.50
Short Answer Questions10 questions
Q163 Marks
Define classification of data.
View sample solutionHide solution
Classification is the process of arranging raw data into homogeneous groups or classes based on common characteristics — by time, place, attribute or magnitude. It turns a mass of observations into a form that reveals patterns and is ready for further analysis.
Q173 Marks
Distinguish between discrete and continuous variables.
View sample solutionHide solution
A discrete variable takes only specified numerical values (usually integers) — e.g. number of children per family. A continuous variable can take any value within an interval, including fractions — e.g. height, weight, income. Continuous data are grouped into class intervals for analysis.
Q183 Marks
Distinguish between the inclusive and exclusive methods of class intervals.
View sample solutionHide solution
In the exclusive method the upper limit of a class is excluded from that class (e.g. 10-20 covers 10 up to but not including 20). In the inclusive method both limits are included (e.g. 10-19 covers both 10 and 19). The exclusive method is preferred for continuous data; the inclusive method is used for discrete data and needs adjustment before graphical analysis.
Q193 Marks
What is a frequency array?
View sample solutionHide solution
A frequency array is the simplest form of a frequency distribution for a discrete variable — it lists each distinct value of the variable alongside the number of times it occurs (its frequency). Example: number of children 0, 1, 2, 3 with frequencies 5, 12, 8, 3.
Q203 Marks
State any two principles of constructing a frequency distribution.
View sample solutionHide solution
(i) The number of classes should be moderate — usually 5 to 15 — to balance detail with clarity. (ii) Class intervals should be of equal width where possible, mutually exclusive, and exhaustive so that every observation falls into exactly one class.
Q213 Marks
What is meant by classification of data in statistics?
View sample solutionHide solution
Classification of data refers to the process of arranging raw data into groups or classes based on similarities and differences. It helps in simplifying complex data and making it easier to understand and analyze. For example, students can be classified based on their marks into different groups.
Q223 Marks
Distinguish between qualitative and quantitative data with one example each.
View sample solutionHide solution
Qualitative data refers to data that describes attributes or characteristics that cannot be measured numerically, such as gender, religion, or color. Quantitative data, on the other hand, refers to data that can be expressed in numerical terms, such as height, weight, or income. Qualitative data is also called categorical data while quantitative data is numerical in nature.
Q233 Marks
What is a frequency distribution table? Why is it useful?
View sample solutionHide solution
A frequency distribution table is a systematic arrangement of data that shows how frequently each value or group of values occurs in a dataset. It organizes raw data into classes or intervals along with their corresponding frequencies. It is useful because it condenses large amounts of data into a compact and readable form, making analysis easier.
Q243 Marks
Differentiate between discrete and continuous data with suitable examples.
View sample solutionHide solution
Discrete data consists of values that are countable and can only take specific whole number values, such as the number of students in a class or the number of cars in a parking lot. Continuous data can take any value within a given range and is measurable, such as height, weight, or temperature. Discrete data has gaps between values while continuous data has no gaps.
Q253 Marks
What is meant by class interval and class frequency in a frequency distribution?
View sample solutionHide solution
A class interval refers to the range of values grouped together into a single class in a frequency distribution, for example 10–20 or 20–30. Class frequency refers to the number of observations that fall within a particular class interval. Together, they form the basis of a frequency distribution table and help in summarizing data effectively.
Long Answer Questions6 questions
Q266 Marks
Explain the objectives of classification of data.
View sample solutionHide solution
Objectives of classification: (i) Condensation — reduces a mass of raw data to a compact and intelligible form. (ii) Comparison — facilitates comparison between groups (classes, regions, periods). (iii) Highlights similarities and differences — reveals the structure of the data by arranging similar items together. (iv) Aids further analysis — grouped data form the basis for averaging, dispersion, correlation and index numbers. (v) Eliminates unnecessary detail — focuses attention on the main features. (vi) Reveals patterns — e.g. concentration of households in a particular income range. Altogether classification bridges the gap between raw data and meaningful economic inference.
Q276 Marks
Explain different types of classification of data with examples.
View sample solutionHide solution
(1) Chronological classification — data arranged by time periods; e.g. India's GDP 2010, 2015, 2020, 2023. (2) Spatial / geographical classification — data arranged by place; e.g. state-wise literacy rates. (3) Qualitative classification — based on attributes that cannot be numerically measured; e.g. population divided by sex (male / female) or by literacy (literate / illiterate). (4) Quantitative classification — based on numerical variables; subdivided into discrete (e.g. number of family members) and continuous (e.g. height, income). Each type answers a different question and often more than one is used together; e.g. state-wise (spatial) literacy rates over time (chronological).
Q286 Marks
Describe the procedure of constructing a frequency distribution for raw continuous data.
View sample solutionHide solution
Steps: (1) Determine range R = largest − smallest observation. (2) Decide number of classes — usually 5 to 15; a common thumb-rule is k = 1 + 3.322 × log10 N. (3) Determine class width h ≈ R / k, rounded to a convenient number. (4) Decide class limits using either the exclusive method (10-20, 20-30,...) or the inclusive method (10-19, 20-29,...). (5) Tally each observation into its class and count tally marks to obtain frequency. (6) Check that total of frequencies equals N. (7) Add cumulative frequencies if needed for median/quartile calculation. (8) Label with a title, units and source. The result is a compact summary that is ready for averaging, dispersion, graphical presentation and further analysis.
Q296 Marks
Distinguish between exclusive and inclusive methods of class intervals with examples.
View sample solutionHide solution
Exclusive method: the upper limit of each class is not included in that class but is the lower limit of the next. Example — 0-10, 10-20, 20-30; an observation of 20 goes in 20-30, not 10-20. It is ideal for continuous data because it keeps the distribution without gaps. Inclusive method: both the lower and upper limits of a class are included. Example — 0-9, 10-19, 20-29; there is a gap of 1 between 9 and 10. It is used for discrete data (where values are integers) but creates a problem for continuous data — we therefore convert it to a continuous distribution by adjusting limits (subtract 0.5 from lower and add 0.5 to upper) before drawing histograms or ogives.
Q306 Marks
Explain the concept of a statistical series and its types.
View sample solutionHide solution
A statistical series is an orderly arrangement of the values of a variable, or of the frequencies of its classes, according to some logical principle. Main types: (1) Individual series — each observation is listed separately with no frequency grouping; used for small data sets (e.g. marks of 10 students). (2) Discrete series — a frequency array for a discrete variable; each distinct value is tabulated with its frequency (e.g. number of children per family). (3) Continuous series — a frequency distribution over class intervals for a continuous variable; each class is tabulated with its frequency (e.g. heights grouped 150-160, 160-170 cm). (4) Cumulative series — cumulative frequencies up to or beyond a class limit, used for ogives and percentile computations. The type chosen must match the nature of the variable and the analysis planned.
Q316 Marks
Compare classification and tabulation of data with the help of a table.
Assertion–Reason Questions8 questions
Q321 Mark
Assertion (A): Classification of raw data helps in revealing patterns.
Reason (R): Grouping similar items together makes the characteristics of the data visible.
Show explanationHide explanation
Correct answer: Option 1 —
Both A and R are true, and R is the correct explanation of A.
Q331 Mark
Assertion (A): A continuous variable can take any value within an interval.
Reason (R): Unlike discrete variables it is not restricted to isolated numbers and can take fractional values.
Show explanationHide explanation
Correct answer: Option 1 —
Both A and R are true, and R is the correct explanation of A.
Q341 Mark
Assertion (A): The exclusive method avoids ambiguity at class boundaries.
Reason (R): The upper limit of a class is excluded from that class and becomes the lower limit of the next.
Show explanationHide explanation
Correct answer: Option 1 —
Both A and R are true, and R is the correct explanation of A.
Q351 Mark
Assertion (A): Too many class intervals reduce the clarity of a frequency distribution.
Reason (R): Extra classes spread the observations thin and hide the pattern that a moderate number would reveal.
Show explanationHide explanation
Correct answer: Option 1 —
Both A and R are true, and R is the correct explanation of A.
Q361 Mark
Assertion (A): A frequency distribution can only be prepared for discrete data.
Reason (R): Frequency distributions can also be built for continuous variables by grouping values into class intervals.
Show explanationHide explanation
Correct answer: Option 4 —
A is false, but R is true.
Q371 Mark
Assertion (A): Qualitative data cannot be measured numerically.
Reason (R): Qualitative data describes attributes or characteristics such as gender, colour, or religion which are non-numeric in nature.
Show explanationHide explanation
Correct answer: Option 1 —
Both A and R are true, and R is the correct explanation of A.
Q381 Mark
Assertion (A): A frequency distribution table helps in summarising a large set of raw data.
Reason (R): Frequency distribution arranges data into classes and shows how frequently each class occurs, making data easier to analyse.
Show explanationHide explanation
Correct answer: Option 1 —
Both A and R are true, and R is the correct explanation of A.
Q391 Mark
Assertion (A): Discrete data can take any value within a given range.
Reason (R): Continuous data can take any value within a range, whereas discrete data can only take specific, countable values.
Show explanationHide explanation
Correct answer: Option 4 —
A is false, but R is true.
Correct answer: Option 1 —
Both statements are true.
Q411 Mark
Statement 1: The difference between the upper and lower limits of a class is the class width.
Statement 2: The average of the upper and lower limits of a class is the class mid-point.
Show answerHide answer
Correct answer: Option 1 —
Both statements are true.
Q421 Mark
Statement 1: The class mid-point is used to represent a class for averaging.
Statement 2: The mid-point is the arithmetic mean of the upper and lower class limits.
Show answerHide answer
Correct answer: Option 1 —
Both statements are true.
Q431 Mark
Statement 1: The inclusive method of class intervals may leave apparent gaps between successive classes.
Statement 2: The data must therefore be adjusted before drawing a histogram or an ogive.
Show answerHide answer
Correct answer: Option 1 —
Both statements are true.
Q441 Mark
Statement 1: Raw data is unorganised and difficult to analyse.
Statement 2: Classified or grouped data is arranged so that summary statistics can be computed.
Show answerHide answer
Correct answer: Option 1 —
Both statements are true.
Q451 Mark
Statement 1: Qualitative data refers to data that can be measured numerically.
Statement 2: Quantitative data refers to data that can be expressed in numerical terms.
Show answerHide answer
Correct answer: Option 3 —
Only Statement 2 is true.
Q461 Mark
Statement 1: A frequency distribution table shows how data is distributed across different classes or intervals.
Statement 2: Cumulative frequency is obtained by adding the frequency of each class to the sum of frequencies of all preceding classes.
Show answerHide answer
Correct answer: Option 1 —
Both statements are true.
Q471 Mark
Statement 1: Discrete data can take any value within a given range, including fractions and decimals.
Statement 2: Continuous data can take any value within a given range, including fractions and decimals.
Show answerHide answer
Correct answer: Option 3 —
Only Statement 2 is true.
Case Study / Passage Questions4 questions
Q483 Marks
A researcher has income data (₹'000 per year) for 50 households: 10, 18, 22, 22, 25, 28, 30, 32, 35, 36, 38, 40, 40, 41, 42, 42, 44, 45, 45, 46, 48, 50, 50, 52, 54, 55, 55, 56, 58, 60, 60, 62, 64, 65, 66, 68, 68, 70, 72, 74, 76, 78, 80, 85, 90, 95, 100, 110, 120, 150. She wants to summarise the data.
The most useful summary form for 50 income figures is:
ARaw list of observations
BA classified frequency distribution
COnly the median
DOnly a scatter diagram
The range of incomes (in ₹'000) is:
A10
B100
C140
D50
Describe how you would construct a frequency distribution for the data.
Show answersHide answers
1. Option 2 — A classified frequency distribution
2. Option 3 — 140
3. Choose a class width of about ₹25 000 and class limits 0-25, 25-50, 50-75, 75-100, 100-125, 125-150. Tally each observation into its class and count frequencies. The resulting grouped distribution shows the concentration of households around the ₹25-75 000 range more clearly than the raw list.
Q493 Marks
Teacher A uses class intervals 0-10, 10-20, 20-30 for marks of continuous scale. Teacher B uses 0-9, 10-19, 20-29 for the same marks. An observation is recorded as 10.
Under Teacher A's convention a mark of 10 falls in class:
A0-10
B10-20
CBoth classes
DNeither class
Under Teacher B's convention the same mark 10 falls in class:
A0-9
B10-19
C20-29
DCannot be placed
Explain when each method is preferred and why.
Show answersHide answers
1. Option 2 — 10-20
2. Option 2 — 10-19
3. The exclusive method (Teacher A) suits continuous data because each observation falls unambiguously into exactly one class without gaps. The inclusive method (Teacher B) is convenient for discrete data but creates apparent gaps that must be closed (subtracting 0.5 from lower and adding 0.5 to upper limit) before drawing histograms or ogives.
Q503 Marks
A researcher collects two datasets. In the first she counts the number of children in each of 200 families. In the second she measures the height (in cm) of each of 200 adults.
The 'number of children' variable is best classified as:
AContinuous
BDiscrete
CQualitative
DOrdinal
The 'height' variable is best classified as:
AContinuous
BDiscrete
CQualitative
DNominal
Why is it important to distinguish between discrete and continuous variables?
Show answersHide answers
1. Option 2 — Discrete
2. Option 1 — Continuous
3. A discrete variable takes only certain values (typically integers) — no family has 2.6 children. A continuous variable can take any value within a range, including fractional values — an adult can be 165.2 cm tall. Discrete data are shown as frequency arrays; continuous data are grouped into class intervals.
Q514 Marks
A statistics teacher collected data on the marks obtained by 50 students in a class test. The marks ranged from 10 to 95. She decided to organize this data into a frequency distribution table. She created class intervals of equal width: 10-20, 20-30, 30-40, 40-50, 50-60, 60-70, 70-80, 80-90, 90-100. She then counted how many students fell in each class interval and recorded the frequency. This process of arranging raw data into groups or classes is known as classification of data. The resulting table helped her quickly identify that most students scored between 50 and 70 marks, and very few scored below 20 or above 90.
The process of arranging raw data into groups or classes is called:
ATabulation
BClassification
CFrequency Distribution
DCumulative Frequency
In the frequency distribution described, the class intervals are of:
AUnequal width
BOpen-ended type
CEqual width
DCumulative type
What is the class width (class size) of each interval used by the teacher?
Why is organizing raw data into a frequency distribution table useful?
Show answersHide answers
1. Option 2 — Classification
2. Option 3 — Equal width
3. The class width (class size) of each interval is 10, as each class interval spans 10 marks (e.g., 10-20, 20-30, etc.).
4. Organizing raw data into a frequency distribution table makes it easier to analyze, interpret, and identify patterns in the data. It helps in quickly identifying where most values are concentrated and simplifies large datasets for comparison and further statistical analysis.
Table-Based Questions4 questions
Q523 Marks
Study the frequency distribution of marks and answer:
Marks
Frequency
0-10
4
10-20
8
20-30
12
30-40
10
40-50
6
The total number of students is:
A20
B30
C40
D50
The modal class (highest frequency) is:
A0-10
B10-20
C20-30
D30-40
Describe the overall shape of this distribution.
Show answersHide answers
1. Option 3 — 40
2. Option 3 — 20-30
3. The total frequency is 4 + 8 + 12 + 10 + 6 = 40 students. The 20-30 class has the highest frequency (12), making it the modal class. The distribution is roughly symmetric around this class.
Q533 Marks
Study the qualitative and quantitative classification and answer:
Basis
Type
Example
Sex
Qualitative
Male / Female
Literacy
Qualitative
Literate / Illiterate
Age
Quantitative (continuous)
0-10, 10-20, ... years
Family size
Quantitative (discrete)
1, 2, 3, ... members
Classification by sex is:
AQualitative
BQuantitative continuous
CQuantitative discrete
D
Classification by family size is:
AQualitative
BQuantitative continuous
CQuantitative discrete
D
Distinguish between qualitative and quantitative classification based on this table.
Show answersHide answers
1. Option 1 — Qualitative
2. Option 3 — Quantitative discrete
3. Qualitative classification uses attributes; quantitative classification uses numerical variables. Quantitative splits further into discrete (integer values) and continuous (any real value in a range). Each type demands a specific summary technique.
Q545 Marks
Construct a frequency distribution with a class width of 10 for the following marks of 30 students, using the exclusive method.
Marks (raw)
5, 8, 9, 12, 14, 15, 16, 18, 18, 19
21, 22, 24, 25, 25, 26, 27, 28, 29, 29
31, 32, 34, 35, 37, 38, 39, 41, 44, 48
Q554 Marks
Using the less-than cumulative method, compute the cumulative frequencies and state the median class.
Class
Frequency
0-10
4
10-20
6
20-30
12
30-40
10
40-50
8
Picture-Based Questions4 questions
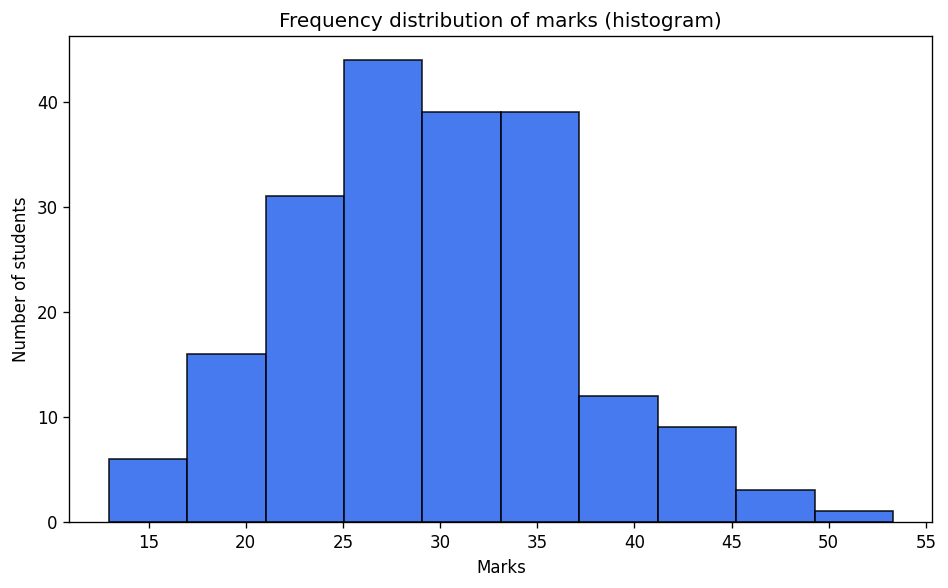
Q563 Marks
Study the frequency histogram of student marks and answer:
The shape of the distribution is:
ABimodal
BRoughly symmetric / bell-shaped
CStrongly skewed
DUniform
Most students score marks roughly:
AAround 15-20
BAround 25-35
CAround 45-55
DOnly the extremes
State any two advantages of a histogram as a presentation tool.
Show answersHide answers
1. Option 2 — Roughly symmetric / bell-shaped
2. Option 2 — Around 25-35
3. A histogram uses adjacent rectangles over continuous class intervals; the area of each bar represents frequency. It reveals the shape of the distribution (symmetric / skewed / uniform / multimodal) at a glance and underpins choice of the appropriate central-tendency and dispersion measures.
Q574 Marks
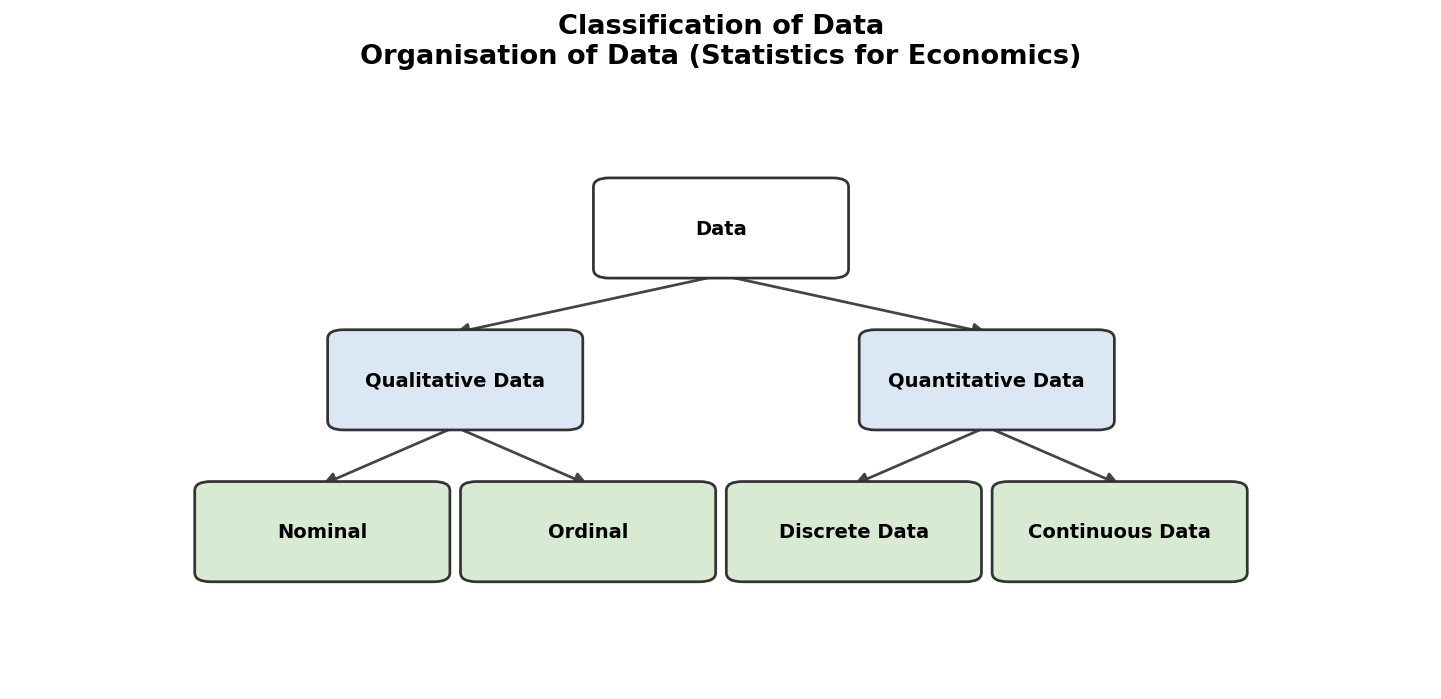
Based on the given diagram, answer the following:
Which type of data can be measured and expressed numerically?
AQualitative Data
BNominal Data
CQuantitative Data
DOrdinal Data
Give one example each of discrete data and continuous data.
Which of the following is an example of qualitative (nominal) data?
AMarks scored in an exam
BHeight of students
CReligion of individuals
DNumber of cars sold
Distinguish between ordinal and nominal qualitative data with an example.
Show answersHide answers
1. Option 3 — Quantitative Data
2. Discrete data example: Number of students in a class. Continuous data example: Height or weight of students.
3. Option 3 — Religion of individuals
4. Nominal data has no natural order (e.g., gender, religion), while ordinal data has a meaningful order or rank (e.g., satisfaction levels: poor, average, good, excellent).
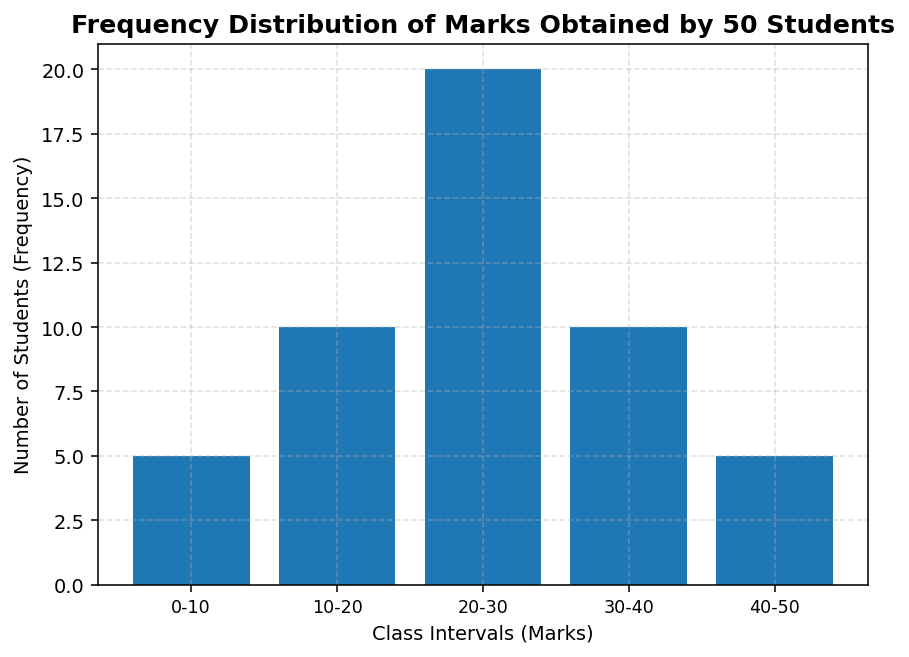
Q584 Marks
Based on the given bar chart showing the frequency distribution of marks obtained by 50 students, answer the following:
Which class interval has the highest frequency?
A0-10
B10-20
C20-30
D30-40
What is the total number of students represented in the frequency distribution?
A40
B45
C50
D55
Calculate the cumulative frequency for the class interval up to 30 marks.
What does the term 'class interval' mean in the context of frequency distribution?
Show answersHide answers
1. Option 3 — 20-30
2. Option 3 — 50
3. Cumulative frequency up to 30 marks = 5 + 10 + 20 = 35 students.
4. A class interval is a range of values within which data is grouped in a frequency distribution. For example, 20-30 means all values from 20 to less than 30 are included in this group.
Q594 Marks
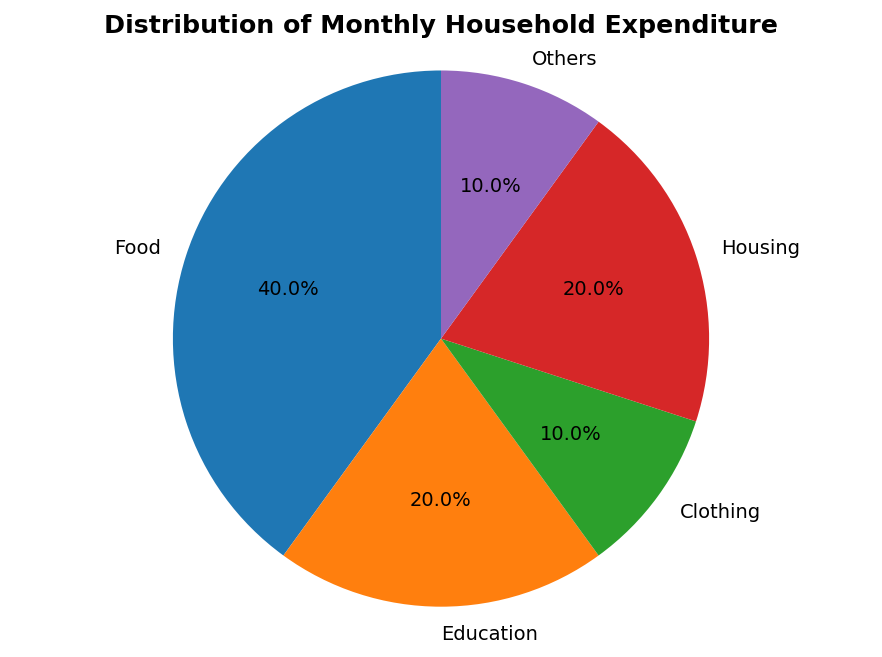
Based on the given pie chart showing the distribution of household expenditure, answer the following:
Which category accounts for the largest share of household expenditure?
AEducation
BHousing
CFood
DClothing
If the total monthly expenditure is ₹20,000, how much is spent on Education?
A₹2,000
B₹4,000
C₹6,000
D₹8,000
What is the angle (in degrees) representing the 'Housing' sector in the pie chart?
State one advantage of using a pie chart for representing this type of data.
Show answersHide answers
1. Option 3 — Food
2. Option 2 — ₹4,000
3. Angle for Housing = (20/100) × 360° = 72°.
4. A pie chart clearly shows the proportion or percentage share of each component in relation to the whole, making it easy to compare parts of a total at a glance.