Measures of Dispersion (Statistics for Economics) — Important Questions
58 questions
With answersCBSE format
SUMMARY: The chapter "Measures of Dispersion" in Class 11 Economics focuses on the statistical tools used to measure the spread or variability of a data set. KEY TOPICS: range, quartile deviation, mean deviation, standard deviation, variance, coefficient of variation, absolute measures, relative measures, interpretation of dispersion, applications of dispersion in economics.
Correct answer: Option 3 — Semi-Inter-Quartile Range
Q91 Mark
If the variance of a data set is 36, what is the standard deviation?
A1296
B18
C12
D6
Check answerHide answer
Correct answer: Option 4 — 6
Q101 Mark
Mean Deviation is least when calculated from which measure of central tendency?
AMode
BMean
CMedian
DGeometric Mean
Check answerHide answer
Correct answer: Option 3 — Median
Q111 Mark
Which of the following is a relative measure of dispersion?
AStandard Deviation
BRange
CMean Deviation
DCoefficient of Variation
Check answerHide answer
Correct answer: Option 4 — Coefficient of Variation
Q121 Mark
For the data set: 4, 8, 12, 16, 20 — what is the value of Range?
A12
B16
C20
D24
Check answerHide answer
Correct answer: Option 2 — 16
Q131 Mark
Which measure of dispersion takes into account all the values of the data set and is considered the most reliable?
ARange
BQuartile Deviation
CStandard Deviation
DMean Deviation from Mode
Check answerHide answer
Correct answer: Option 3 — Standard Deviation
Q141 Mark
Two series A and B have means of 50 and 40, and standard deviations of 10 and 12 respectively. Which series is more consistent?
ASeries A, because its CV is 20% which is lower than Series B's CV of 30%
BSeries B, because its standard deviation is higher
CSeries A, because its mean is higher
DSeries B, because its CV is 20% which is lower than Series A's CV of 30%
Check answerHide answer
Correct answer: Option 1 — Series A, because its CV is 20% which is lower than Series B's CV of 30%
Q151 Mark
For a frequency distribution, if Q1 = 20 and Q3 = 60, what is the Coefficient of Quartile Deviation?
A0.25
B0.33
C0.50
D0.67
Check answerHide answer
Correct answer: Option 3 — 0.50
Short Answer Questions10 questions
Q163 Marks
Define range and compute the range of 15, 8, 22, 11, 31, 9.
View sample solutionHide solution
Range is the difference between the largest and smallest observation: R = L − S. For the given data L = 31 and S = 8, so R = 31 − 8 = 23.
Q173 Marks
Distinguish between absolute and relative measures of dispersion.
View sample solutionHide solution
Absolute measures express dispersion in the same units as the data — range, quartile deviation, mean deviation, standard deviation. Relative measures are unit-free ratios (e.g. coefficient of variation = σ / ¯X × 100) and are used to compare dispersion in series measured in different units or at very different scales.
Q183 Marks
Define standard deviation.
View sample solutionHide solution
Standard deviation (σ) is the positive square root of the arithmetic mean of the squared deviations of observations from their arithmetic mean: σ = √[ Σ(X − ¯X)² / N ]. It uses every observation, is minimum when deviations are taken from the mean, and is the most widely accepted measure of dispersion.
Q193 Marks
What is coefficient of variation? Why is it useful?
View sample solutionHide solution
Coefficient of variation (CV) = (σ / ¯X) × 100. It expresses standard deviation as a percentage of the mean and is a unit-free relative measure, making it ideal for comparing dispersion between two series with different units or very different means.
Q203 Marks
What does the Lorenz curve represent?
View sample solutionHide solution
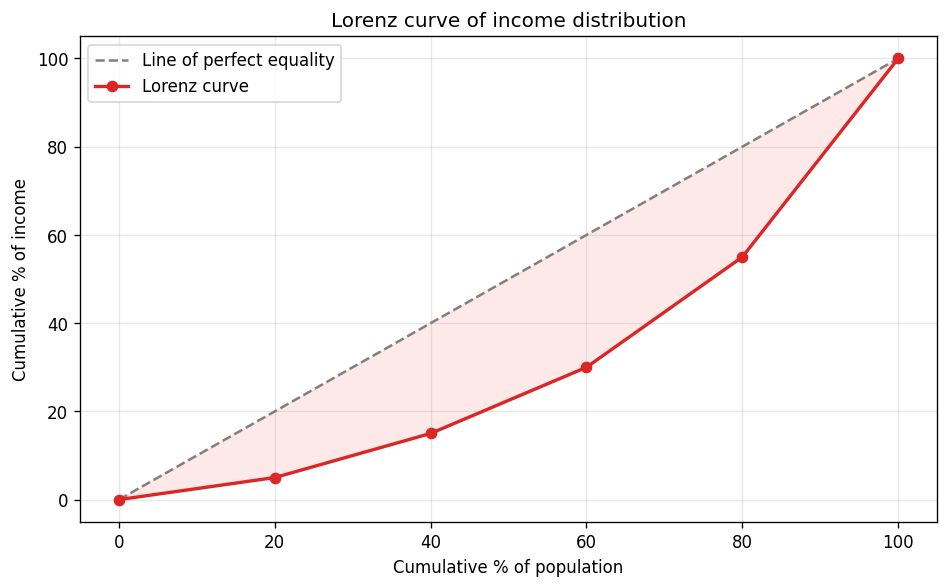
The Lorenz curve plots cumulative percentage of population on the X-axis against cumulative percentage of income (or wealth) on the Y-axis. The 45° line is the line of perfect equality; the farther the curve lies from this line, the greater the inequality. It is commonly used to study income distribution.
Q213 Marks
Define 'Range' as a measure of dispersion. How is it calculated?
View sample solutionHide solution
Range is the simplest measure of dispersion that shows the difference between the largest and smallest values in a data set. It is calculated as: Range = Maximum Value − Minimum Value. A larger range indicates greater variability in the data.
Q223 Marks
What is meant by Quartile Deviation? Write its formula.
View sample solutionHide solution
Quartile Deviation (also called Semi-Interquartile Range) measures the spread of the middle 50% of the data. It is calculated as: QD = (Q3 − Q1) / 2, where Q3 is the third quartile and Q1 is the first quartile. It is less affected by extreme values compared to Range.
Q233 Marks
Distinguish between absolute measures and relative measures of dispersion.
View sample solutionHide solution
Absolute measures of dispersion are expressed in the same units as the original data (e.g., Range, Mean Deviation, Standard Deviation), while relative measures are expressed as ratios or percentages and are unit-free (e.g., Coefficient of Variation). Relative measures are used to compare variability between two or more data sets with different units or scales.
Q243 Marks
What is Mean Deviation? Why is it considered a better measure than Range?
View sample solutionHide solution
Mean Deviation is the arithmetic average of the absolute deviations of all values from a central value (mean, median, or mode). It is considered better than Range because it takes all observations into account, not just the two extreme values. This makes it a more representative measure of the overall spread of the data.
Q253 Marks
Define Variance and Standard Deviation. How are they related to each other?
View sample solutionHide solution
Variance is the arithmetic mean of the squared deviations of all values from their mean, and it measures the average spread of data around the mean. Standard Deviation is the positive square root of Variance, expressed in the same units as the original data. The relationship is: Standard Deviation (σ) = √Variance (σ²).
Long Answer Questions6 questions
Q266 Marks
Explain the different measures of dispersion with examples.
View sample solutionHide solution
(1) Range = Largest − Smallest; quickest measure but uses only the two extreme values. (2) Quartile deviation (semi-inter-quartile range) = (Q3 − Q1) / 2; uses middle 50% and ignores extreme values; useful for skewed data. (3) Mean deviation — arithmetic mean of the absolute deviations from the median or the mean; uses every observation but absolute signs make further algebraic handling awkward. (4) Standard deviation (σ) — positive square root of the arithmetic mean of squared deviations from the mean; uses every observation, is algebraically tractable, and is the most important measure of dispersion. (5) Relative measures — coefficient of range, coefficient of quartile deviation, coefficient of mean deviation and coefficient of variation — are unit-free and allow comparison between series with different units or scales.
Q276 Marks
Calculate the standard deviation of 10 observations: 12, 15, 18, 20, 22, 24, 26, 28, 30, 35.
View sample solutionHide solution
Mean ¯X = (12+15+18+20+22+24+26+28+30+35) / 10 = 230 / 10 = 23. Deviations (X − ¯X): −11, −8, −5, −3, −1, 1, 3, 5, 7, 12. Squared deviations: 121, 64, 25, 9, 1, 1, 9, 25, 49, 144. Σ(X − ¯X)² = 448. Variance = 448 / 10 = 44.8. Standard deviation σ = √44.8 ≈ 6.69. So σ ≈ 6.69 units. Coefficient of variation = (σ / ¯X) × 100 = (6.69 / 23) × 100 ≈ 29.1%. The CV tells us dispersion is about 29% of the mean.
Q286 Marks
Distinguish between absolute and relative measures of dispersion with examples.
View sample solutionHide solution
Absolute measures are expressed in the same units as the variable and measure dispersion directly — range, quartile deviation, mean deviation and standard deviation. Relative measures are ratios (usually multiplied by 100) of absolute measures to an average and are unit-free: coefficient of range = (L − S) / (L + S); coefficient of quartile deviation = (Q3 − Q1) / (Q3 + Q1); coefficient of mean deviation = mean deviation / mean (or median); coefficient of variation CV = (σ / ¯X) × 100. Use of absolute measures is limited to the same units and similar means; relative measures allow comparison across different units (e.g. wages in rupees and weights in kg) or scales. CV is especially popular because it uses the most reliable absolute measure (σ).
Q296 Marks
Explain the Lorenz curve as a measure of inequality.
View sample solutionHide solution
The Lorenz curve is a graphical device to study the inequality of a distribution — most commonly incomes, wealth, landholdings or profits. Construction: (1) Arrange data by category and compute percentages. (2) Compute cumulative percentages of population (X-axis) and of the variable — say income (Y-axis). (3) Plot cumulative % of population against cumulative % of income. (4) Join the points smoothly. The 45° line from origin is the line of perfect equality (every x% of people own x% of income). The Lorenz curve usually lies below the 45° line; the greater the distance from the line, the greater the inequality. Area between the line and the curve, divided by the total area under the line, gives the Gini coefficient. For international comparisons of inequality (e.g. countries, regions), and to evaluate redistributive policy, Lorenz curves are the standard visualisation.
Q306 Marks
Compute the quartile deviation for the data 18, 22, 25, 27, 30, 33, 35, 40, 45.
View sample solutionHide solution
Arrange data in ascending order (already ordered): 18, 22, 25, 27, 30, 33, 35, 40, 45. N = 9. Q1 lies at (N + 1)/4 = 10/4 = 2.5th position; Q1 = 22 + 0.5 × (25 − 22) = 22 + 1.5 = 23.5. Q3 lies at 3(N + 1)/4 = 3 × 10 / 4 = 7.5th position; Q3 = 35 + 0.5 × (40 − 35) = 35 + 2.5 = 37.5. Quartile deviation (semi-inter-quartile range) = (Q3 − Q1) / 2 = (37.5 − 23.5) / 2 = 7. Coefficient of QD = (Q3 − Q1) / (Q3 + Q1) = 14 / 61 ≈ 0.23. Since it ignores the extreme 25% of observations at each end, QD is especially useful for skewed data where the range and standard deviation may be distorted.
Q316 Marks
Compare range and standard deviation as measures of dispersion with the help of a table.
Assertion–Reason Questions8 questions
Q321 Mark
Assertion (A): Range is an absolute measure of dispersion.
Reason (R): It is expressed in the same units as the data and depends solely on the maximum and minimum values.
Show explanationHide explanation
Correct answer: Option 1 —
Both A and R are true, and R is the correct explanation of A.
Q331 Mark
Assertion (A): Standard deviation is the most accepted absolute measure of dispersion.
Reason (R): It uses every observation and is suitable for further algebraic treatment.
Show explanationHide explanation
Correct answer: Option 1 —
Both A and R are true, and R is the correct explanation of A.
Q341 Mark
Assertion (A): Coefficient of variation is useful for comparing dispersion across series with different units.
Reason (R): It is a unit-free ratio of the standard deviation to the mean.
Show explanationHide explanation
Correct answer: Option 1 —
Both A and R are true, and R is the correct explanation of A.
Q351 Mark
Assertion (A): Quartile deviation is a positional measure of dispersion.
Reason (R): It depends only on the first and third quartiles Q1 and Q3, not on every observation.
Show explanationHide explanation
Correct answer: Option 1 —
Both A and R are true, and R is the correct explanation of A.
Q361 Mark
Assertion (A): A Lorenz curve that lies close to the line of equality indicates high inequality.
Reason (R): The 45° line of perfect equality is the benchmark against which the curve's distance is measured.
Show explanationHide explanation
Correct answer: Option 4 —
A is false, but R is true.
Q371 Mark
Assertion (A): Range is the simplest measure of dispersion.
Reason (R): Range is calculated as the difference between the maximum and minimum values in a data set.
Show explanationHide explanation
Correct answer: Option 1 —
Both A and R are true, and R is the correct explanation of A.
Q381 Mark
Assertion (A): Standard deviation is considered the best measure of dispersion.
Reason (R): Standard deviation takes into account all values in the data set and is based on deviations from the mean.
Show explanationHide explanation
Correct answer: Option 1 —
Both A and R are true, and R is the correct explanation of A.
Q391 Mark
Assertion (A): Coefficient of Variation is an absolute measure of dispersion.
Reason (R): Coefficient of Variation is expressed as a percentage and is used to compare variability of two or more series.
Show explanationHide explanation
Correct answer: Option 4 —
A is false, but R is true.
Statement-Based Questions8 questions
Q401 Mark
Statement 1: Range is the difference between the largest and smallest observations.
Statement 2: Range is the simplest but least refined measure of dispersion.
Show answerHide answer
Correct answer: Option 1 —
Both statements are true.
Q411 Mark
Statement 1: Mean deviation can be computed from either the arithmetic mean or the median.
Statement 2: Standard deviation is always computed with reference to the arithmetic mean.
Show answerHide answer
Correct answer: Option 1 —
Both statements are true.
Q421 Mark
Statement 1: Coefficient of variation is a relative measure of dispersion.
Statement 2: It is useful for comparing the variability of series with different units or scales.
Show answerHide answer
Correct answer: Option 1 —
Both statements are true.
Q431 Mark
Statement 1: The Lorenz curve is a graphical representation of inequality.
Statement 2: The more it diverges from the 45° line of equality the greater the inequality.
Show answerHide answer
Correct answer: Option 1 —
Both statements are true.
Q441 Mark
Statement 1: Variance is the square of the standard deviation.
Statement 2: A larger variance indicates greater dispersion of observations around the mean.
Show answerHide answer
Correct answer: Option 1 —
Both statements are true.
Q451 Mark
Statement 1: Range is the simplest measure of dispersion and is calculated as the difference between the maximum and minimum values in a data set.
Statement 2: Range takes into account all the values in the data set while measuring dispersion.
Show answerHide answer
Correct answer: Option 2 —
Only Statement 1 is true.
Q461 Mark
Statement 1: Quartile Deviation is half the difference between the third quartile and the first quartile.
Statement 2: Quartile Deviation is an absolute measure of dispersion and is also known as the Semi-Interquartile Range.
Show answerHide answer
Correct answer: Option 1 —
Both statements are true.
Q471 Mark
Statement 1: Mean Deviation is always calculated from the median because the sum of deviations from the median is zero.
Statement 2: Mean Deviation can be calculated from mean, median, or mode, but it is minimum when calculated from the median.
Show answerHide answer
Correct answer: Option 3 —
Only Statement 2 is true.
Case Study / Passage Questions3 questions
Q483 Marks
Class A has marks: 40, 45, 50, 55, 60. Class B has marks: 10, 35, 50, 65, 90. Both classes have the same mean but different dispersion.
The range of Class A is:
A20
B40
C60
D80
The range of Class B is:
A50
B60
C80
D100
Compute the standard deviation for both classes and comment.
Show answersHide answers
1. Option 1 — 20
2. Option 3 — 80
3. For Class A: mean = 50, deviations −10, −5, 0, 5, 10; SD = √((100+25+0+25+100)/5) = √50 ≈ 7.07. For Class B: mean = 50, deviations −40, −15, 0, 15, 40; SD = √((1600+225+0+225+1600)/5) = √730 ≈ 27.02. Although the two classes share the same mean (50), Class B has much larger dispersion — reflected in a range of 80 vs 20 and an SD of 27 vs 7. A single mean therefore hides the very different spread.
Q493 Marks
Series X has mean ¯X = 50 and SD σ = 10 in rupees. Series Y has mean ¯Y = 200 kilograms and SD σ = 20 kg. The researcher wants to compare the relative variability.
Which series has the higher absolute standard deviation?
Compute and compare the coefficients of variation for X and Y.
Show answersHide answers
1. Option 2 — Y
2. Option 1 — X has higher relative variability
3. CV of X = (10 / 50) × 100 = 20%; CV of Y = (20 / 200) × 100 = 10%. Although Y has a higher absolute SD, its relative variability is smaller. Series X is more variable in relative terms, so comparisons across series with different units should use CV, not SD alone.
Q503 Marks
Country A has a Lorenz curve lying very close to the 45° line of equality. Country B has a Lorenz curve that bows far below the 45° line.
Which country has greater inequality?
ACountry A
BCountry B
CBoth equal
DCannot say
The 45° line on the Lorenz graph represents:
AEquality of income
BPerfect inequality
CMean income
DRange of income
Explain why the Lorenz curve is an intuitive tool for visualising inequality.
Show answersHide answers
1. Option 2 — Country B
2. Option 1 — Equality of income
3. The Lorenz curve plots cumulative population share against cumulative income share. Perfect equality would produce a 45° line — the poorest 10% of the population would earn 10% of total income, and so on. The further the Lorenz curve dips below the line, the greater the concentration of income among the top earners, hence greater inequality. The area between the line and the curve, divided by the total area under the line, is the Gini coefficient.
Table-Based Questions4 questions
Q513 Marks
Study the two production series and answer:
Series
Mean
Standard deviation
CV (%)
Factory A
500 units
25
5.0
Factory B
200 units
20
10.0
Which factory has the higher absolute dispersion of output?
AFactory A
BFactory B
CBoth equal
DCannot say
Which factory has the higher relative dispersion (CV)?
AFactory A
BFactory B
CBoth equal
DNeither
Why should a manager prefer CV when comparing variability across factories?
Show answersHide answers
1. Option 1 — Factory A
2. Option 2 — Factory B
3. Absolute dispersion (SD) can mislead when mean levels differ. Factory A's SD of 25 is larger in absolute terms, but Factory B's CV of 10% is larger in relative terms. Relative measures like CV control for level differences and are preferred when comparing series with different units or scales.
Q523 Marks
Study the income distribution and Lorenz computation and answer:
Population quintile
Share of population (%)
Share of income (%)
Poorest 20%
20
5
Second 20%
20
10
Middle 20%
20
15
Fourth 20%
20
25
Richest 20%
20
45
The poorest 40% of the population earns approximately:
A5%
B15%
C25%
D45%
The richest 20% of the population earns:
A5%
B30%
C45%
D70%
Describe the inequality shown by the data using the Lorenz-curve concept.
Show answersHide answers
1. Option 2 — 15%
2. Option 3 — 45%
3. The poorest 40% earn only 15% of income (5 + 10), while the richest 20% earn 45%. The Lorenz curve plotted from these numbers would lie well below the 45° line, showing marked inequality. The Gini coefficient can be computed from the area between the two curves; it would be substantial here.
Q534 Marks
Calculate the range and the coefficient of range for the following data.
Observation
12
18
25
33
40
55
62
75
Q545 Marks
Calculate the standard deviation and coefficient of variation from the data below.
Observation
10
12
14
16
18
20
Picture-Based Questions4 questions
Q553 Marks
Study the Lorenz curve of income distribution and answer:
Perfect equality of income would be represented by:
A45° line of equality
BThe Lorenz curve itself
CThe x-axis
DThe y-axis
The further the Lorenz curve lies from the 45° line:
AHigher inequality
BLower inequality
CNo inequality
DCannot say
How is the Gini coefficient derived from this diagram?
Show answersHide answers
1. Option 1 — 45° line of equality
2. Option 1 — Higher inequality
3. The Gini coefficient is defined as the ratio of the area between the 45° equality line and the Lorenz curve, divided by the total area under the equality line. It ranges from 0 (perfect equality) to 1 (perfect inequality) and is widely used for international comparisons of income and wealth distribution.
Q564 Marks
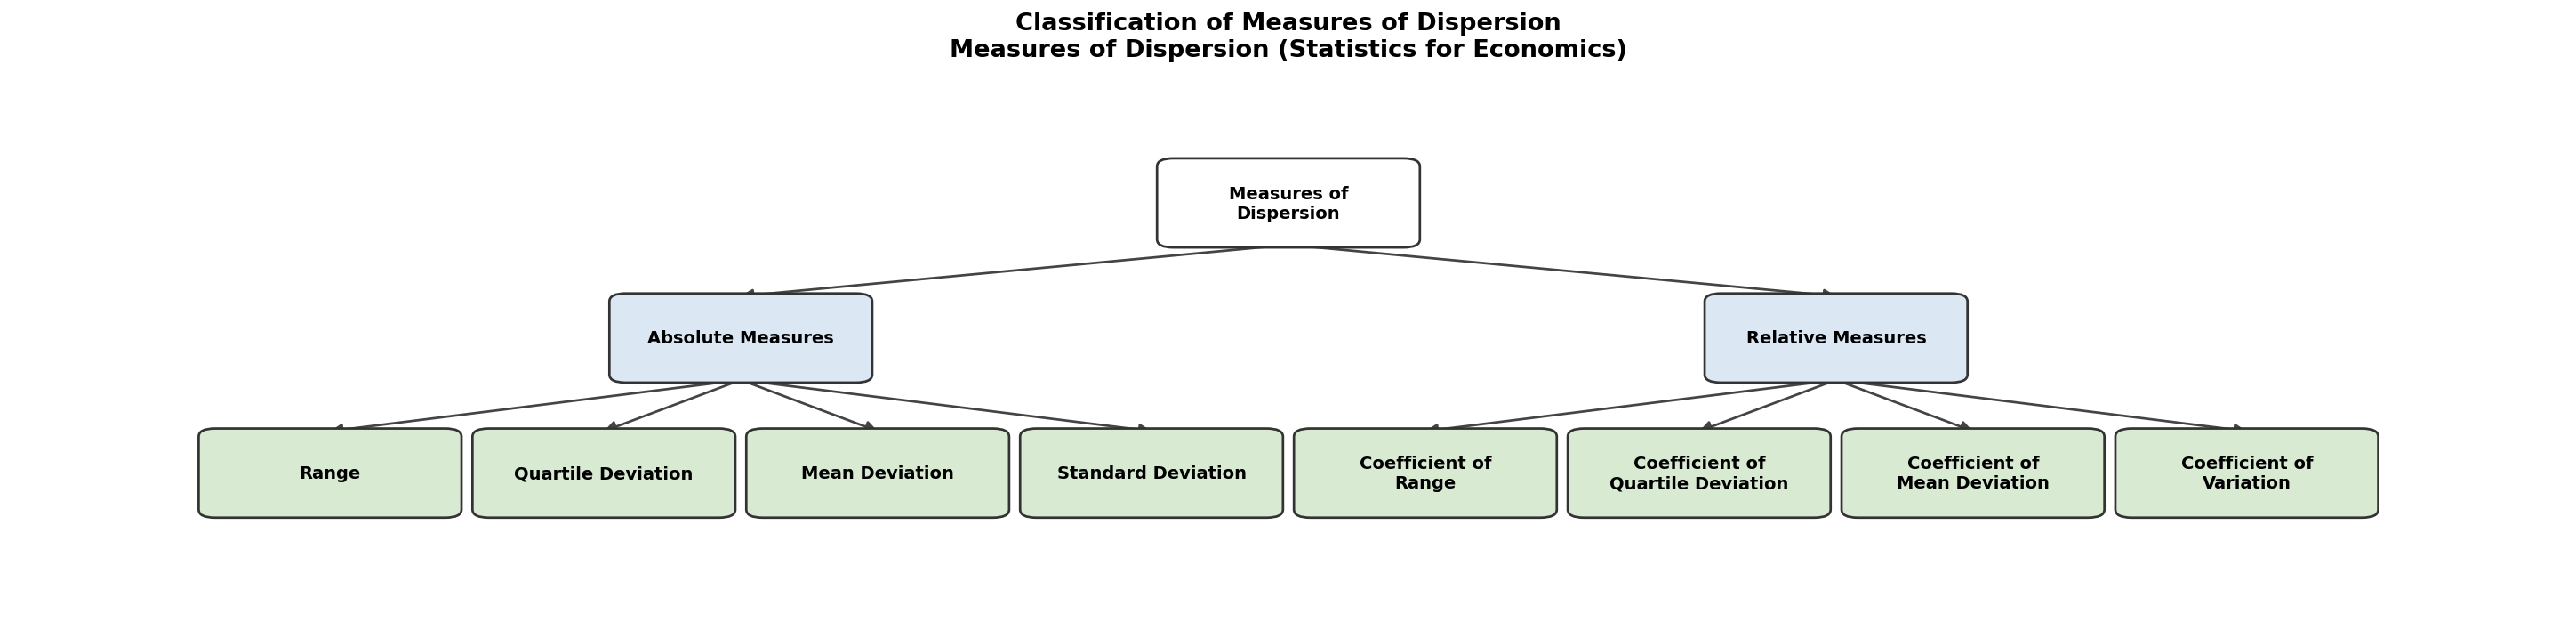
Based on the given flowchart showing the classification of Measures of Dispersion, answer the following:
Which of the following is a relative measure of dispersion?
ARange
BStandard Deviation
CCoefficient of Variation
DMean Deviation
How many absolute measures of dispersion are shown in the flowchart? Name them.
What is the key difference between absolute and relative measures of dispersion?
AAbsolute measures are always larger in value
BRelative measures are expressed as ratios or percentages, making them unit-free
CAbsolute measures can compare two different data sets
DRelative measures depend on the units of measurement
Why is the Coefficient of Variation considered the most useful relative measure of dispersion for comparing two series?
Show answersHide answers
1. Option 3 — Coefficient of Variation
2. There are 4 absolute measures: Range, Quartile Deviation, Mean Deviation, and Standard Deviation.
3. Option 2 — Relative measures are expressed as ratios or percentages, making them unit-free
4. The Coefficient of Variation (CV = SD/Mean × 100) expresses dispersion as a percentage of the mean, making it independent of units and scale. A series with a lower CV is considered more consistent or less variable.
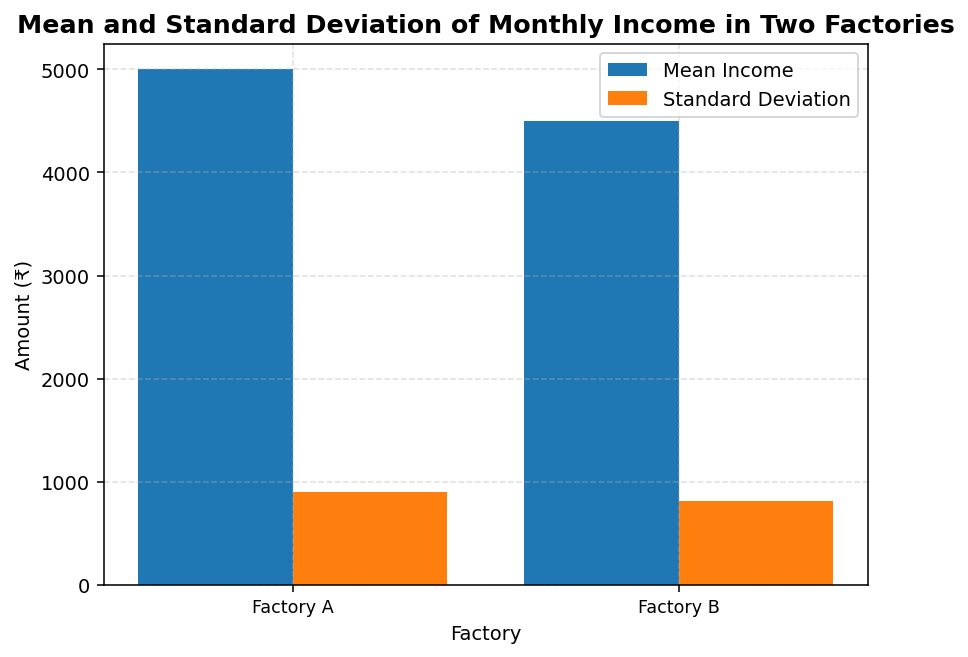
Q574 Marks
Study the bar chart showing the standard deviation and mean of monthly incomes (in ₹) of workers in two factories A and B, and answer the following:
Calculate the Coefficient of Variation (CV) for Factory A.
Calculate the Coefficient of Variation (CV) for Factory B.
A16%
B18%
C20%
D22%
Which factory shows greater consistency in wages and why?
If the standard deviation alone is used to compare variability, which factory appears more variable?
AFactory B, because its mean is lower
BFactory A, because its standard deviation (₹900) is higher than Factory B (₹810)
CBoth are equally variable since CV is the same
DCannot be determined from the given data
Show answersHide answers
1. CV for Factory A = (SD / Mean) × 100 = (900 / 5000) × 100 = 18%
2. Option 2 — 18%
3. Both factories have the same CV of 18%, which means both show equal consistency (variability) in wages. Neither factory is more consistent than the other.
4. Option 2 — Factory A, because its standard deviation (₹900) is higher than Factory B (₹810)
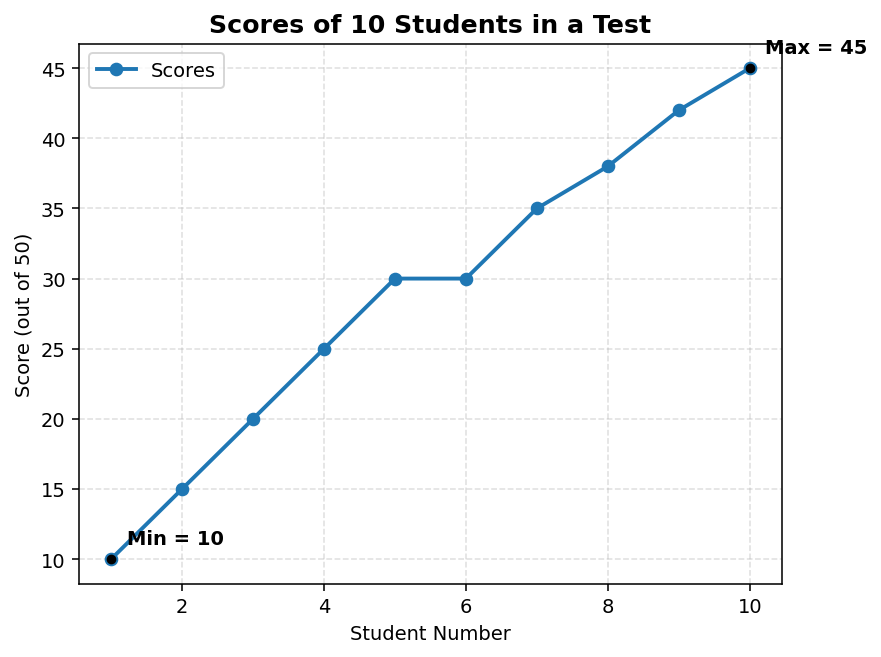
Q584 Marks
The following line graph shows the scores of 10 students in a test. Study the graph and answer the questions related to Range and Mean Deviation:
Calculate the Range of the scores shown in the graph.
A30
B35
C40
D45
What is the formula for the Coefficient of Range? Calculate it using the values from the graph.
What is the mean score of the 10 students based on the data in the graph?
A25
B28
C29
D30
State one major limitation of Range as a measure of dispersion, as illustrated by this data set.
Show answersHide answers
1. Option 2 — 35
2. Coefficient of Range = (L – S) / (L + S) where L = Largest value and S = Smallest value. = (45 – 10) / (45 + 10) = 35 / 55 ≈ 0.636
3. Option 3 — 29
4. Range considers only the two extreme values (maximum and minimum) and ignores all intermediate values. For example, even if most students scored between 20 and 38, the range is entirely determined by the scores 10 and 45, giving a misleading picture of the actual spread.