Measures of Central Tendency (Statistics for Economics) — Important Questions
59 questions
With answersCBSE format
SUMMARY: This chapter focuses on the statistical tools used to summarize and describe the central tendency of a data set in economics. KEY TOPICS: mean, median, mode, arithmetic mean, weighted mean, geometric mean, harmonic mean, properties of averages, merits and demerits of averages, applications in economics
The sum of deviations of observations from their arithmetic mean is always:
APositive
BNegative
CZero
DOne
Check answerHide answer
Correct answer: Option 3 — Zero
Q21 Mark
The median of 8 observations lies at the:
A4th observation
B5th observation
CAverage of 4th and 5th observations
D8th observation
Check answerHide answer
Correct answer: Option 3 — Average of 4th and 5th observations
Q31 Mark
The mode of a distribution is:
AThe middle value
BThe most frequent value
CThe average value
DThe smallest value
Check answerHide answer
Correct answer: Option 2 — The most frequent value
Q41 Mark
For a symmetric distribution, the relation between mean, median and mode is:
AMean = Median = Mode
BMean > Median > Mode
CMode > Median > Mean
DMean = Median only
Check answerHide answer
Correct answer: Option 1 — Mean = Median = Mode
Q51 Mark
The empirical relation 'Mode = 3 Median − 2 Mean' applies to:
ASymmetric distribution
BModerately skewed distribution
CHighly skewed distribution
DBimodal distribution
Check answerHide answer
Correct answer: Option 2 — Moderately skewed distribution
Q61 Mark
Which measure of central tendency is most affected by extreme values (outliers) in a data set?
AMedian
BMode
CArithmetic Mean
DWeighted Mean
Check answerHide answer
Correct answer: Option 3 — Arithmetic Mean
Q71 Mark
The sum of deviations of individual values from the arithmetic mean is always:
AMaximum
BMinimum
COne
DZero
Check answerHide answer
Correct answer: Option 4 — Zero
Q81 Mark
Which average is most suitable when different items in a series have different degrees of importance?
AArithmetic Mean
BWeighted Mean
CGeometric Mean
DHarmonic Mean
Check answerHide answer
Correct answer: Option 2 — Weighted Mean
Q91 Mark
For the data set: 4, 7, 7, 9, 11, 13, 13, 13, 15 — what is the mode?
A9
B11
C13
D7
Check answerHide answer
Correct answer: Option 3 — 13
Q101 Mark
If the arithmetic mean of 5 observations is 20, what is the sum of all observations?
A25
B4
C100
D200
Check answerHide answer
Correct answer: Option 3 — 100
Q111 Mark
The median of the following data: 15, 28, 72, 56, 44, 32, 31, 43, 51 is:
A43
B44
C32
D51
Check answerHide answer
Correct answer: Option 1 — 43
Q121 Mark
Which of the following is a demerit of the Mode as a measure of central tendency?
AIt is not based on all observations
BIt is affected by extreme values
CIt cannot be calculated for open-ended classes
DIt cannot be used for qualitative data
Check answerHide answer
Correct answer: Option 1 — It is not based on all observations
Q131 Mark
Geometric Mean is most appropriately used when dealing with:
AData with extreme values at both ends
BRatios, rates of growth, and percentage changes
CData measured on a nominal scale
DFinding the most frequently occurring value
Check answerHide answer
Correct answer: Option 2 — Ratios, rates of growth, and percentage changes
Q141 Mark
The Harmonic Mean of 2, 4, and 8 is approximately:
A4.00
B3.43
C2.67
D5.14
Check answerHide answer
Correct answer: Option 2 — 3.43
Q151 Mark
In a moderately skewed distribution, the empirical relationship between Mean (M), Median (Md), and Mode (Mo) is given by:
AMo = 3Md − 2M
BMo = 2Md − 3M
CMo = 3M − 2Md
DMo = Md − 2M
Check answerHide answer
Correct answer: Option 1 — Mo = 3Md − 2M
Short Answer Questions10 questions
Q163 Marks
Define arithmetic mean and state one of its important properties.
View sample solutionHide solution
Arithmetic mean is the sum of all observations divided by their number: ¯X = ΣX / N. Key property: the algebraic sum of deviations of observations from their arithmetic mean is zero — Σ(X − ¯X) = 0. This makes the arithmetic mean the 'balance point' of the data.
Q173 Marks
Distinguish between mean and median.
View sample solutionHide solution
Mean is a computed average — sum divided by count — that uses every observation and is therefore influenced by extreme values. Median is a positional average — the middle value when the data are ordered — and is unaffected by extreme values, so it is preferred for skewed distributions such as income.
Q183 Marks
State any two merits and one demerit of the arithmetic mean.
View sample solutionHide solution
Merits: (i) It is rigidly defined and easy to compute. (ii) It is based on all observations and suitable for further algebraic treatment. Demerit: It is unduly affected by extreme values; for highly skewed data (income, prices), the median or mode is often more representative.
Q193 Marks
Define mode and state the formula for mode of a grouped frequency distribution.
View sample solutionHide solution
Mode is the value that occurs with the highest frequency. For a grouped distribution it is computed as Mode = L + [(f1 − f0) / (2f1 − f0 − f2)] × h, where L = lower limit of modal class, f1 = modal-class frequency, f0 and f2 = frequencies of preceding and following classes, and h = class width.
Q203 Marks
State the relationship between mean, median and mode for a moderately skewed distribution.
View sample solutionHide solution
For a moderately skewed distribution the empirical relation holds: Mode ≈ 3 × Median − 2 × Mean. This lets us estimate any one of the three averages when the other two are known. It breaks down for highly skewed or multi-modal distributions.
Q213 Marks
Define Arithmetic Mean and state its basic formula for ungrouped data.
View sample solutionHide solution
Arithmetic Mean is the sum of all observations divided by the total number of observations. For ungrouped data, it is calculated as: Mean (X̄) = ΣX / N, where ΣX is the sum of all values and N is the number of observations. It is the most commonly used measure of central tendency in economics.
Q223 Marks
What is the Weighted Mean and when is it preferred over simple Arithmetic Mean?
View sample solutionHide solution
Weighted Mean is calculated by assigning different weights to different observations based on their relative importance, using the formula: X̄w = ΣwX / Σw. It is preferred over simple Arithmetic Mean when all items in a data set are not of equal importance. For example, it is used in calculating price indices in economics where different commodities have different levels of significance.
Q233 Marks
State any two merits of the Arithmetic Mean as a measure of central tendency.
View sample solutionHide solution
First, Arithmetic Mean is rigidly defined and based on all observations in the data set, making it a reliable and objective measure. Second, it is easy to calculate and understand, and is capable of further algebraic treatment, such as being used in calculating standard deviation and correlation. These properties make it the most widely used average in statistical analysis.
Q243 Marks
Define Median and explain how it is located in an ungrouped data set with an even number of observations.
View sample solutionHide solution
Median is the middle value of a data set when observations are arranged in ascending or descending order, dividing the distribution into two equal halves. When the number of observations (N) is even, the median is calculated as the average of the (N/2)th and (N/2 + 1)th observations. For example, if N = 8, the median is the average of the 4th and 5th values in the ordered data set.
Q253 Marks
What is Mode? How is it identified in a simple data series?
View sample solutionHide solution
Mode is the value that occurs most frequently in a data set and represents the most common or typical value in a distribution. In a simple data series, it is identified by finding the observation with the highest frequency. For example, in the data set {2, 3, 4, 4, 5, 4, 6}, the mode is 4 as it appears three times, more than any other value.
Long Answer Questions6 questions
Q266 Marks
Explain the computation of arithmetic mean for a continuous frequency distribution with a numerical example.
View sample solutionHide solution
For a continuous frequency distribution ¯X = Σ(f m) / Σ f, where m is the mid-point of each class and f its frequency. Example: marks 0-10 (f=4), 10-20 (f=6), 20-30 (f=10), 30-40 (f=5). Mid-points: 5, 15, 25, 35. f·m products: 20, 90, 250, 175. Σ(f m) = 535, Σ f = 25. ¯X = 535 / 25 = 21.4. The arithmetic mean is 21.4 marks. Short-cut (assumed-mean) method: choose an assumed mean A, compute d = m − A, then ¯X = A + Σ(f d) / Σ f. Further simplification with step-deviation uses u = d / h for equal class widths. The same value ¯X is obtained by all three methods.
Q276 Marks
Explain the merits and demerits of arithmetic mean.
View sample solutionHide solution
Merits: (1) Rigidly defined — no ambiguity in its calculation. (2) Based on every observation, so uses all information in the data. (3) Suitable for further algebraic and statistical treatment (standard deviation, coefficient of variation, correlation). (4) Easy to compute and understand. (5) For a sample, it is an unbiased estimator of the population mean. Demerits: (1) Unduly affected by extreme values — billionaires distort the mean income of a village. (2) Cannot be computed for qualitative data. (3) Cannot be determined from a frequency distribution with open-end classes without assumptions. (4) May give a value that does not actually occur in the data. (5) Misleading for highly skewed distributions, where the median or mode better represents the 'typical' value.
Q286 Marks
Explain how to compute the median from a continuous frequency distribution with a numerical example.
View sample solutionHide solution
Median = L + [(N/2 − C) / f] × h, where L = lower limit of the median class, N = total frequency, C = cumulative frequency of the class preceding the median class, f = frequency of the median class, h = width of the median class. Example: Classes 0-10, 10-20, 20-30, 30-40, 40-50 with frequencies 4, 6, 10, 5, 5; N = 30. Cumulative: 4, 10, 20, 25, 30. N/2 = 15, so the median class is 20-30 (cumulative reaches 20 here). L = 20, C = 10, f = 10, h = 10. Median = 20 + [(15 − 10) / 10] × 10 = 20 + 5 = 25. So the median is 25. Median is unaffected by extreme values and is therefore preferred for skewed distributions.
Q296 Marks
Compare the three averages — mean, median and mode — and state when each is most appropriate.
View sample solutionHide solution
Mean — arithmetic average. Uses every observation; best for symmetric and roughly normal distributions; sensitive to extreme values. Preferred for algebraic work (standard deviation, regression). Median — middle value of ordered data. Positional; not affected by extreme values; ideal for skewed distributions like income, land-holding size. Used when open-end classes exist. Mode — most frequent value. Only average that can be used for qualitative data (e.g. modal shoe size). Useful in business contexts where 'what sells most' matters. When to choose: symmetric distributions — mean is appropriate. Skewed distributions (income, wealth) — median. Categorical / qualitative data or ready-reckoner purposes — mode. For moderately skewed data, the empirical relation Mode ≈ 3 Median − 2 Mean is useful for comparison.
Q306 Marks
Explain the computation of mode for a continuous frequency distribution with a numerical example.
View sample solutionHide solution
Mode = L + [(f1 − f0) / (2 f1 − f0 − f2)] × h, where L = lower limit of the modal class (the class with the highest frequency), f1 = frequency of the modal class, f0 = frequency of the preceding class, f2 = frequency of the following class, h = width of the modal class. Example: Classes 0-10, 10-20, 20-30, 30-40 with frequencies 4, 9, 12, 6. Modal class = 20-30 (frequency 12). L = 20, f1 = 12, f0 = 9, f2 = 6, h = 10. Mode = 20 + [(12 − 9) / (2·12 − 9 − 6)] × 10 = 20 + (3 / 9) × 10 ≈ 20 + 3.33 = 23.33. So the modal value of the distribution is about 23.3. Mode is useful when the most frequently occurring class is of primary interest.
Q316 Marks
Compare arithmetic mean median and mode with the help of a table on uses and limitations.
Assertion–Reason Questions8 questions
Q321 Mark
Assertion (A): The algebraic sum of deviations of observations from their arithmetic mean is zero.
Reason (R): The mean is the balance point at which positive and negative deviations exactly cancel.
Show explanationHide explanation
Correct answer: Option 1 —
Both A and R are true, and R is the correct explanation of A.
Q331 Mark
Assertion (A): The median is unaffected by extreme values.
Reason (R): It depends only on the position of the middle observation in ordered data.
Show explanationHide explanation
Correct answer: Option 1 —
Both A and R are true, and R is the correct explanation of A.
Q341 Mark
Assertion (A): Mode is the value that occurs with the highest frequency.
Reason (R): It represents the most typical observation in a data set and can be computed even for qualitative data.
Show explanationHide explanation
Correct answer: Option 1 —
Both A and R are true, and R is the correct explanation of A.
Q351 Mark
Assertion (A): The empirical relation Mode = 3 Median − 2 Mean holds for a moderately skewed distribution.
Reason (R): The relation has been found to approximate the link between the three averages when skewness is not extreme.
Show explanationHide explanation
Correct answer: Option 1 —
Both A and R are true, and R is the correct explanation of A.
Q361 Mark
Assertion (A): Weighted arithmetic mean is appropriate when items differ in importance.
Reason (R): Attaching weights reflecting their importance avoids giving equal treatment to items of unequal significance.
Show explanationHide explanation
Correct answer: Option 1 —
Both A and R are true, and R is the correct explanation of A.
Q371 Mark
Assertion (A): The arithmetic mean is affected by extreme values in a data set.
Reason (R): The arithmetic mean is calculated by summing all observations and dividing by the number of observations, making it sensitive to very large or very small values.
Show explanationHide explanation
Correct answer: Option 1 —
Both A and R are true, and R is the correct explanation of A.
Q381 Mark
Assertion (A): The median is the most appropriate measure of central tendency for open-ended frequency distributions.
Reason (R): The median divides the distribution into two equal halves and does not require the actual values of extreme items for its calculation.
Show explanationHide explanation
Correct answer: Option 1 —
Both A and R are true, and R is the correct explanation of A.
Q391 Mark
Assertion (A): The mode is always uniquely defined for every data set.
Reason (R): A data set can have more than one mode (bimodal or multimodal) or may have no mode at all if all values occur with equal frequency.
Show explanationHide explanation
Correct answer: Option 4 —
A is false, but R is true.
Statement-Based Questions8 questions
Q401 Mark
Statement 1: The arithmetic mean is the sum of observations divided by their count.
Statement 2: It is the simplest and most widely used measure of central tendency.
Show answerHide answer
Correct answer: Option 1 —
Both statements are true.
Q411 Mark
Statement 1: For grouped data the median lies in the class whose cumulative frequency first reaches N/2.
Statement 2: For grouped data the mode lies in the class with the highest frequency.
Show answerHide answer
Correct answer: Option 1 —
Both statements are true.
Q421 Mark
Statement 1: Median is a positional average.
Statement 2: Median is less affected by extreme values than the arithmetic mean.
Show answerHide answer
Correct answer: Option 1 —
Both statements are true.
Q431 Mark
Statement 1: Quartiles divide ordered data into four equal parts.
Statement 2: Deciles divide ordered data into ten equal parts.
Show answerHide answer
Correct answer: Option 1 —
Both statements are true.
Q441 Mark
Statement 1: Mode = 3 Median − 2 Mean is valid for moderately skewed distributions.
Statement 2: The empirical relation breaks down for highly skewed or bimodal data.
Show answerHide answer
Correct answer: Option 1 —
Both statements are true.
Q451 Mark
Statement 1: The arithmetic mean is affected by extreme values in a data set.
Statement 2: The median is also affected by extreme values in a data set.
Show answerHide answer
Correct answer: Option 2 —
Only Statement 1 is true.
Q461 Mark
Statement 1: The mode is the value that appears most frequently in a data set.
Statement 2: A data set can have only one mode.
Show answerHide answer
Correct answer: Option 2 —
Only Statement 1 is true.
Q471 Mark
Statement 1: The sum of deviations of all values from the arithmetic mean is always zero.
Statement 2: The sum of deviations of all values from the median is always zero.
Show answerHide answer
Correct answer: Option 2 —
Only Statement 1 is true.
Case Study / Passage Questions4 questions
Q483 Marks
The daily wage of 5 workers in a small workshop is ₹200, ₹220, ₹240, ₹260 and ₹280. The owner wants to compute the average daily wage.
The arithmetic mean wage is:
A₹220
B₹240
C₹250
D₹260
Which measure uses every observation in this dataset?
AArithmetic mean
BMedian
CMode
DRange
Compute the arithmetic mean step-by-step and comment on its appropriateness.
Show answersHide answers
1. Option 2 — ₹240
2. Option 1 — Arithmetic mean
3. Sum of wages = 200 + 220 + 240 + 260 + 280 = ₹1200. N = 5. Arithmetic mean = 1200 / 5 = ₹240. Since there is no extreme value and the distribution is symmetric about 240, the arithmetic mean is a representative average here.
Q493 Marks
The wages of 5 workers in a small firm were ₹200, ₹220, ₹240, ₹260 and ₹280. A new worker joins and the firm now has wages ₹200, ₹220, ₹240, ₹260, ₹280 and ₹5000 (the owner's draw).
The new arithmetic mean is approximately:
A₹240
B₹250
C₹1033
D₹280
The new median of the six values is:
A₹240
B₹250
C₹260
D₹1033
Explain why the median is preferred when data have extreme values.
Show answersHide answers
1. Option 3 — ₹1033
2. Option 2 — ₹250
3. The owner's draw of ₹5000 is an extreme value. It pulls the arithmetic mean up from ₹240 to (1200 + 5000) / 6 = ₹1033, a value unrepresentative of the typical worker. The median (average of the 3rd and 4th values 240 and 260) is ₹250, which remains a sensible 'middle' figure. This is why the median is preferred for skewed data like incomes.
Q503 Marks
A shop records the shoe sizes of 15 male customers: 7, 7, 8, 8, 8, 9, 9, 9, 9, 10, 10, 10, 10, 11, 12.
The mode of this distribution is:
A8
B9
CBoth 9 and 10
D11
A distribution with two values that appear with the highest (and equal) frequency is:
AUnimodal
BBimodal
CTrimodal
DNo mode
Why is the mode a natural choice for a retailer deciding inventory?
Show answersHide answers
1. Option 3 — Both 9 and 10
2. Option 2 — Bimodal
3. Both 9 (4 occurrences) and 10 (4 occurrences) are the modal values — the distribution is bimodal. For the shoe shop this means it should stock these two sizes in the largest quantities. The mean and median would not reveal this feature equally clearly.
Q514 Marks
A teacher recorded the marks of 10 students in an Economics test: 45, 52, 60, 48, 70, 55, 62, 58, 50, 40. She wanted to find the average performance of the class. The arithmetic mean is calculated by summing all values and dividing by the number of observations. This measure is widely used in economics because it takes into account every value in the dataset. However, it is sensitive to extreme values called outliers. For example, if one student scored very high or very low, the mean would be pulled in that direction. The teacher also noted that the sum of deviations of all values from the arithmetic mean is always zero, which is one of its important mathematical properties.
What is the arithmetic mean of the marks: 45, 52, 60, 48, 70, 55, 62, 58, 50, 40?
A54
B55
C54.5
D56
Which property of arithmetic mean states that the sum of deviations from the mean is always zero?
ARigidity
BAlgebraic property
CLeast squares property
DWeighted property
What is a major demerit of arithmetic mean mentioned in the passage?
If an 11th student scoring 100 is added to the dataset, the arithmetic mean will:
ADecrease
BRemain the same
CIncrease
DBecome zero
Show answersHide answers
1. Option 1 — 54
2. Option 2 — Algebraic property
3. A major demerit of arithmetic mean is that it is unduly affected by extreme values (outliers). A very high or very low value can distort the mean and make it unrepresentative of the data.
4. Option 3 — Increase
Table-Based Questions4 questions
Q523 Marks
Study the marks distribution and answer:
Marks
Number of students
0-10
4
10-20
6
20-30
10
30-40
5
40-50
5
The modal class (highest frequency) is:
A20-30
B30-40
C10-20
D0-10
Using midpoints, the arithmetic mean ¯X ≈ Σ(f m) / Σ f is closest to:
A15
B25
C30
D35
Compute the arithmetic mean for the distribution and comment on the result.
Show answersHide answers
1. Option 1 — 20-30
2. Option 2 — 25
3. Σ f = 30. Midpoints: 5, 15, 25, 35, 45. f·m: 20, 90, 250, 175, 225. Σ(f m) = 760. ¯X = 760 / 30 ≈ 25.3. The arithmetic mean is approximately 25.3, which lies inside the 20-30 modal class and is a reasonable representative value for a moderately symmetric distribution.
Q533 Marks
Study the household income data (₹'000) and answer:
Income class
Number of households
Cumulative
0-10
4
4
10-20
8
12
20-30
12
24
30-40
10
34
40-50
6
40
The median class (the class containing N/2 = 20th observation) is:
A20-30
B10-20
C30-40
D0-10
Which measure of central tendency is most robust to extreme values?
AMean
BMedian
CMode
DRange
Compute the median income using the median formula.
Show answersHide answers
1. Option 1 — 20-30
2. Option 2 — Median
3. N = 40, so median lies at N/2 = 20. Cumulative frequency first exceeds 20 in the 20-30 class. L = 20, C = 12, f = 12, h = 10. Median = 20 + [(20 − 12) / 12] × 10 ≈ 20 + 6.67 = ₹26.67 thousand. This is the income below which 50% of households fall.
Q545 Marks
Calculate the arithmetic mean of the following frequency distribution using the direct method.
Class
Frequency
0-10
4
10-20
8
20-30
12
30-40
10
40-50
6
Q555 Marks
Calculate the median of the following frequency distribution.
Class
Frequency
0-10
5
10-20
8
20-30
15
30-40
14
40-50
8
Picture-Based Questions4 questions
Q563 Marks
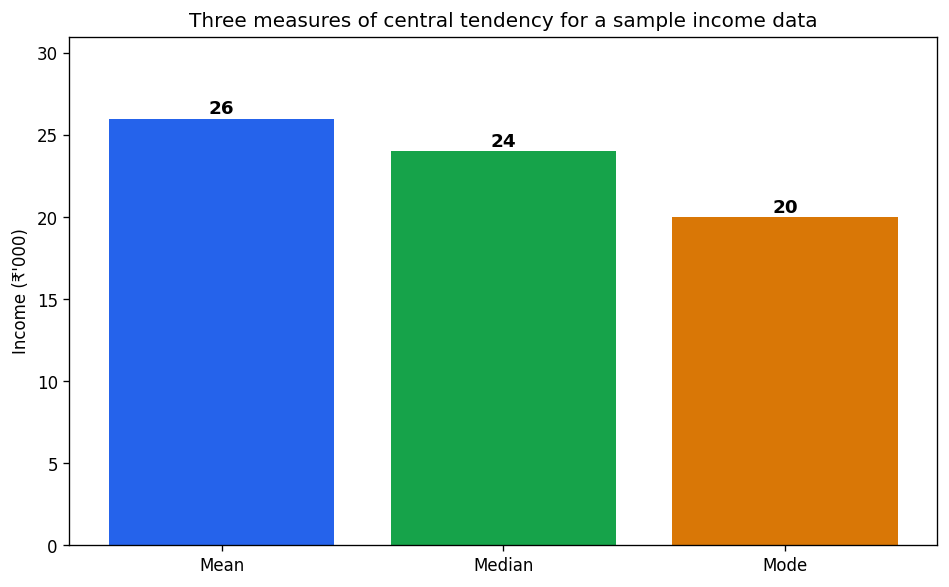
Study the three measures of central tendency and answer:
Which measure takes the highest value for this data set?
AMean
BMedian
CMode
D
Mean > Median > Mode usually indicates a:
ASymmetric distribution
BRight-skewed (positively skewed)
CLeft-skewed
DUniform distribution
Why is the mean higher than median and mode here?
Show answersHide answers
1. Option 1 — Mean
2. Option 2 — Right-skewed (positively skewed)
3. The mean is sensitive to extreme (high) values in the data and is pulled up, while the median and mode stay closer to the centre of the bulk of observations. For right-skewed distributions such as income, the mean therefore exceeds the median which exceeds the mode, as this chart shows.
Q574 Marks
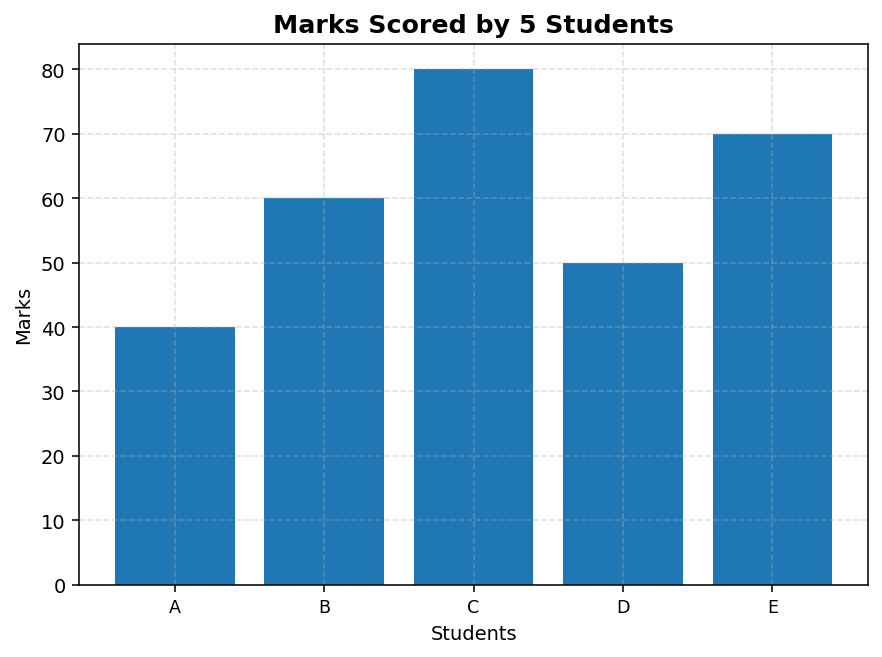
Based on the given bar chart showing the marks scored by 5 students, answer the following:
What is the arithmetic mean of the marks scored by the 5 students?
A55
B60
C65
D70
Which student scored marks equal to the arithmetic mean?
AStudent A
BStudent B
CStudent C
DStudent D
What is the median of the marks scored by the 5 students? Show your working.
State one property of arithmetic mean illustrated by this data.
Show answersHide answers
1. Option 2 — 60
2. Option 2 — Student B
3. Arranging in ascending order: 40, 50, 60, 70, 80. Median = value of ((5+1)/2)th item = 3rd item = 60.
4. The sum of deviations of all observations from the arithmetic mean is always zero. Here: (40-60)+(60-60)+(80-60)+(50-60)+(70-60) = -20+0+20-10+10 = 0.
Q584 Marks
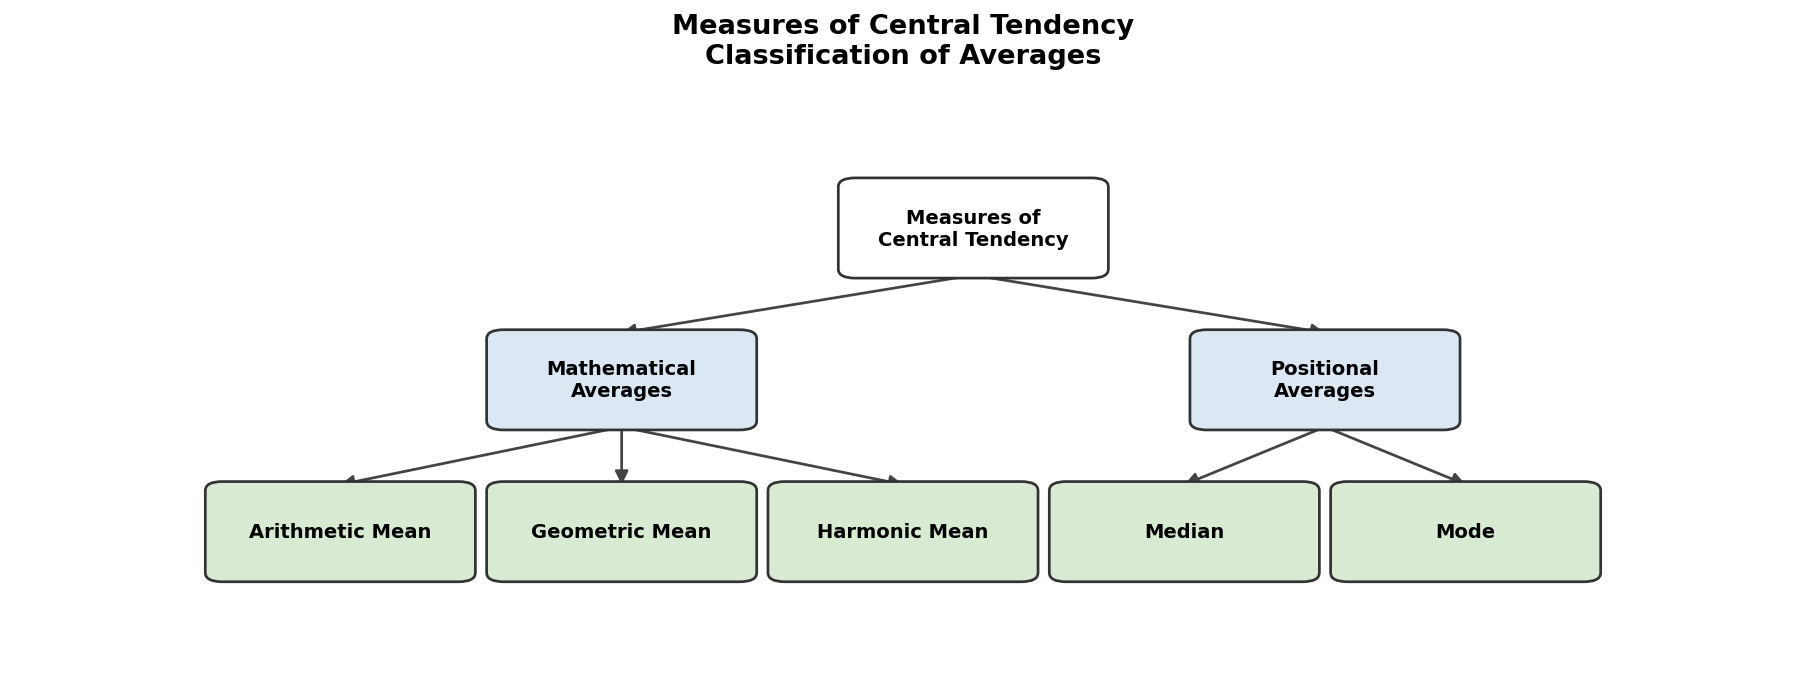
Based on the given flowchart showing the classification of Measures of Central Tendency, answer the following:
According to the flowchart, which of the following is a Positional Average?
AArithmetic Mean
BGeometric Mean
CMedian
DHarmonic Mean
How many types of Mathematical Averages are shown in the flowchart?
A1
B2
C3
D4
Explain why Median and Mode are called 'Positional Averages'.
State one merit of Arithmetic Mean over Mode.
Show answersHide answers
1. Option 3 — Median
2. Option 3 — 3
3. Median and Mode are called Positional Averages because their values are determined by the position of items in the data series, not by the algebraic sum of all values. Median is the middle value and Mode is the most frequently occurring value.
4. Arithmetic Mean is based on all observations in the dataset and is capable of further algebraic treatment, whereas Mode only considers the most frequently occurring value and may not be unique or representative of all data.
Q594 Marks
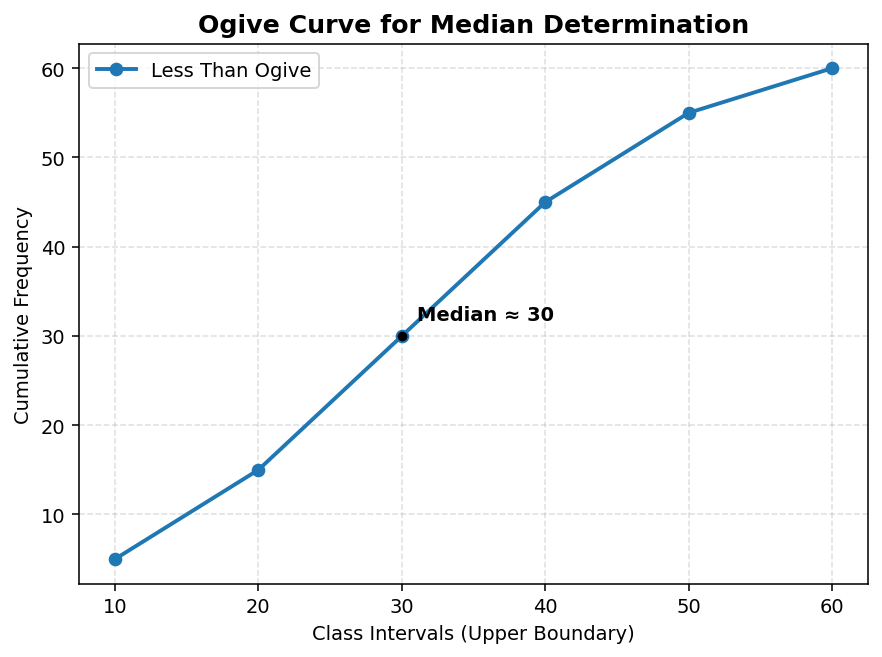
Based on the given line graph showing cumulative frequency (ogive) used to determine the Median, answer the following:
What is the total number of observations (N) in the dataset?
A45
B55
C60
D30
To locate the Median from the ogive, at which cumulative frequency value should a horizontal line be drawn?
A15
B30
C45
D60
From the ogive, what is the approximate value of the Median? Explain the graphical method used.
State one advantage of using the graphical method (ogive) to find the Median.
Show answersHide answers
1. Option 3 — 60
2. Option 2 — 30
3. The approximate Median is 30. In the graphical method, a horizontal line is drawn from N/2 = 30 on the Y-axis to meet the ogive curve. From that point, a vertical line is dropped to the X-axis. The value on the X-axis (≈30) gives the Median.
4. One advantage of the graphical method is that it provides a quick visual estimate of the Median without complex calculations, making it easy to understand and interpret even for large datasets.