SUMMARY: The chapter on Statistics in Class 11 Mathematics focuses on the collection, presentation, analysis, and interpretation of numerical data. KEY TOPICS: Measures of central tendency, measures of dispersion, mean deviation, variance, standard deviation, analysis of frequency distributions, graphical representation of data, cumulative frequency curves, skewness, kurtosis.
Correct answer: Option 1 — Mean of squared deviations from the mean
Q51 Mark
The standard deviation of 5 5 5 5 5 is:
A0
B1
C5
D25
Check answerHide answer
Correct answer: Option 1 — 0
Short Answer Questions5 questions
Q63 Marks
Find the mean of 5 10 15 20 25.
View sample solutionHide solution
Mean = (5 + 10 + 15 + 20 + 25)/5 = 75/5 = 15.
Q73 Marks
Define mean median and mode of a data set.
View sample solutionHide solution
Mean: arithmetic average = sum/count. Median: middle value when data is sorted (or average of the two middle values for even count). Mode: most frequently occurring value(s).
Q83 Marks
Find the variance of the data 4 6 8 10 12.
View sample solutionHide solution
Mean = 8. Deviations: −4 −2 0 2 4 with squared deviations 16 4 0 4 16; sum = 40. Variance = 40/5 = 8.
Q93 Marks
Find the median of the data 7 2 9 4 5 11 3.
View sample solutionHide solution
Sorted: 2 3 4 5 7 9 11. Middle value (4th of 7) is 5. Median = 5.
Q103 Marks
If mean and standard deviation of a data are 30 and 6 respectively find the coefficient of variation.
The mean of 8 observations is 25. If two observations 11 and 19 are deleted what is the mean of the remaining 6 observations?
View sample solutionHide solution
Sum of original 8 = 25 × 8 = 200. After deleting 11 and 19: new sum = 200 − 11 − 19 = 170. Number of remaining observations = 6. New mean = 170/6 ≈ 28.33.
Q136 Marks
For the frequency distribution: x: 10 20 30 40 50; f: 4 6 8 7 5, find the mean.
Compare measures of central tendency: mean median and mode with the help of a table.
Assertion–Reason Questions5 questions
Q171 Mark
Assertion (A): The mean of a data set is the sum of values divided by the number of values.
Reason (R): The mean represents a typical or average value of the data.
Show explanationHide explanation
Correct answer: Option 1 —
Both A and R are true, and R is the correct explanation of A.
Q181 Mark
Assertion (A): The variance of a data set is always non-negative.
Reason (R): Variance is the average of squared deviations from the mean and squares are non-negative.
Show explanationHide explanation
Correct answer: Option 1 —
Both A and R are true, and R is the correct explanation of A.
Q191 Mark
Assertion (A): The standard deviation has the same units as the original data.
Reason (R): SD is the positive square root of variance which has units that are the square of the data units.
Show explanationHide explanation
Correct answer: Option 1 —
Both A and R are true, and R is the correct explanation of A.
Q201 Mark
Assertion (A): If all values in a data set are identical the variance is 0.
Reason (R): There is no spread when all values are equal so the deviations from the mean are all zero.
Show explanationHide explanation
Correct answer: Option 1 —
Both A and R are true, and R is the correct explanation of A.
Q211 Mark
Assertion (A): The coefficient of variation is dimensionless.
Reason (R): CV is the ratio of SD to the mean expressed as a percentage so units cancel.
Show explanationHide explanation
Correct answer: Option 1 —
Both A and R are true, and R is the correct explanation of A.
Statement-Based Questions5 questions
Q221 Mark
Statement 1: The mean median and mode are measures of central tendency.
Statement 2: The range and variance are measures of dispersion.
Show answerHide answer
Correct answer: Option 1 —
Both statements are true.
Q231 Mark
Statement 1: The mean is sensitive to outliers.
Statement 2: The median is more robust to extreme values than the mean.
Show answerHide answer
Correct answer: Option 1 —
Both statements are true.
Q241 Mark
Statement 1: Variance is the square of the standard deviation.
Statement 2: Both variance and SD measure the spread of the data.
Show answerHide answer
Correct answer: Option 1 —
Both statements are true.
Q251 Mark
Statement 1: The mean of a frequency distribution equals Σ(f x)/Σf.
Statement 2: The same formula works for ungrouped data when each value has frequency 1.
Show answerHide answer
Correct answer: Option 1 —
Both statements are true.
Q261 Mark
Statement 1: Coefficient of variation is useful for comparing dispersion of data sets with different units.
Statement 2: A higher CV indicates greater relative variability.
Show answerHide answer
Correct answer: Option 1 —
Both statements are true.
Case Study / Passage Questions3 questions
Q273 Marks
A teacher records the marks of 10 students in a Maths test as 35 42 47 50 52 55 58 60 65 70. The teacher wants to find the mean median range and standard deviation.
The mean of the marks is:
A52
B53
C53.4
D55
The median of the marks is:
A52
B53
C53.4
D55
Compute the range and standard deviation.
Show answersHide answers
1. Option 3 — 53.4
2. Option 3 — 53.4
3. Mean = (35 + 42 + 47 + 50 + 52 + 55 + 58 + 60 + 65 + 70)/10 = 534/10 = 53.4. For median: with 10 (even) values sorted, median = (5th + 6th)/2 = (52 + 55)/2 = 53.5. Range = 70 − 35 = 35. Standard deviation requires squared deviations from the mean.
Q283 Marks
Two teams' run scores in 5 matches are: Team A: 30 50 40 60 70; Team B: 50 50 50 50 50. The captain wants to compare consistency using SD and CV.
The team with smaller standard deviation is:
ATeam A
BTeam B
CBoth equal
DCannot decide
The team that is more consistent is:
ATeam A
BTeam B
CBoth equal
DCannot decide
Compute the coefficients of variation for both teams.
Show answersHide answers
1. Option 2 — Team B
2. Option 2 — Team B
3. Team A: mean = 50; deviations −20 0 −10 10 20; squared 400 0 100 100 400; variance = 1000/5 = 200; SD = √200 ≈ 14.14. Team B: all values equal mean; SD = 0. Team B is more consistent (SD = 0).
Q293 Marks
A survey of monthly expenditure (in ₹ 000) of 5 households gives the values 4 5 6 7 8. The analyst wants the variance and standard deviation.
3. SD = √Variance = √25 = 5. CV = (SD/Mean) × 100% = (5/50) × 100 = 10%. CV is dimensionless and useful for comparing dispersions across datasets with different units or scales.
For the dataset 4, 6, 8, 10, 12, compute (i) the mean, (ii) the variance, (iii) the standard deviation, (iv) the coefficient of variation.
Step
Value
Sample size n
5
Mean
?
Variance
?
SD
?
CV%
?
Q336 Marks
For the frequency distribution given, compute the mean, median (approx) and modal class.
x
Frequency f
10
4
20
6
30
8
40
7
50
5
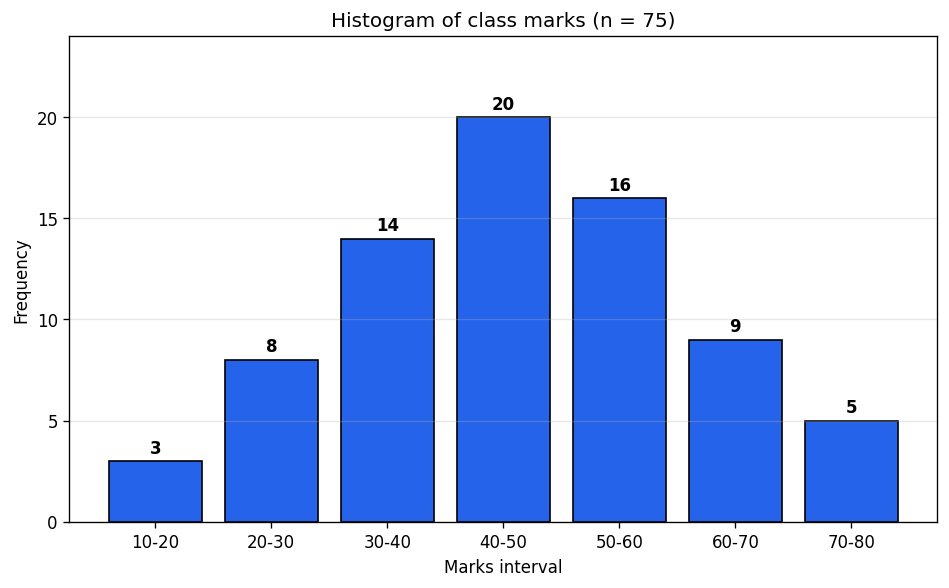
Picture-Based Questions1 question
Q343 Marks
Study the histogram of class marks and answer:
The modal class (highest bar) is:
A20-30
B30-40
C40-50
D50-60
The total frequency (number of students) is:
A50
B60
C75
D100
Describe the shape of the distribution and the location of the mode.
Show answersHide answers
1. Option 3 — 40-50
2. Option 3 — 75
3. Total = 3 + 8 + 14 + 20 + 16 + 9 + 5 = 75 students. The modal class is 40-50 with frequency 20. The distribution is roughly symmetric and bell-shaped, with mean and median both close to the modal class — typical of well-designed exams.