SUMMARY: This chapter focuses on teaching students how to create and customize various types of plots using the Matplotlib library in Python. KEY TOPICS: Matplotlib library, line plot, bar chart, histogram, scatter plot, pie chart, customizing plots, labels and titles, legends, plotting multiple datasets, saving plots
Correct answer: Option 1 —
Both A and R are true, and R is the correct explanation of A.
Q191 Mark
Assertion (A): Pie charts are best for showing parts of a whole.
Reason (R): The slices total 100 percent.
Show explanationHide explanation
Correct answer: Option 1 —
Both A and R are true, and R is the correct explanation of A.
Q201 Mark
Assertion (A): Line plots show trends over time.
Reason (R): Each data point is connected to the next by a line.
Show explanationHide explanation
Correct answer: Option 1 —
Both A and R are true, and R is the correct explanation of A.
Q211 Mark
Assertion (A): plt.savefig() saves a plot to a file.
Reason (R): The format is determined by the file extension (png pdf svg etc).
Show explanationHide explanation
Correct answer: Option 1 —
Both A and R are true, and R is the correct explanation of A.
Statement-Based Questions5 questions
Q221 Mark
Statement 1: plt.plot() draws a line graph.
Statement 2: Multiple plot() calls produce multiple lines on the same figure.
Show answerHide answer
Correct answer: Option 1 —
Both statements are true.
Q231 Mark
Statement 1: plt.bar() and plt.barh() create vertical and horizontal bar charts.
Statement 2: The first argument is the categories the second is the values.
Show answerHide answer
Correct answer: Option 1 —
Both statements are true.
Q241 Mark
Statement 1: plt.title() sets the chart title.
Statement 2: plt.xlabel() and plt.ylabel() set axis labels.
Show answerHide answer
Correct answer: Option 1 —
Both statements are true.
Q251 Mark
Statement 1: plt.legend() displays a legend on the plot.
Statement 2: Each line/series can be labelled using the label parameter.
Show answerHide answer
Correct answer: Option 1 —
Both statements are true.
Q261 Mark
Statement 1: plt.scatter() creates a scatter plot.
Statement 2: It is used to show the relationship between two variables.
Show answerHide answer
Correct answer: Option 1 —
Both statements are true.
Case Study / Passage Questions1 question
Q273 Marks
A small business owner has monthly sales for the year (Jan to Dec). He wants to create a line plot to visualise the trend a bar chart for monthly comparison and a pie chart for the share of each quarter. He uses matplotlib for the visualisations.
Which method creates a line plot?
Aplt.line()
Bplt.plot()
Cplt.bar()
Dplt.pie()
Which method displays a plot?
Aplt.show()
Bplt.display()
Cplt.render()
Dplt.print()
Write Python code to create the three plots and discuss when each is appropriate.
Show answersHide answers
1. Option 2 — plt.plot()
2. Option 1 — plt.show()
3. import matplotlib.pyplot as plt. months = ['Jan' 'Feb' ...]. plt.plot(months sales) plt.title('Sales trend') plt.xlabel('Month') plt.ylabel('Sales') plt.show(). For bar: plt.bar(months sales). For pie of quarters: q1 = sum(sales[0:3]) etc.; plt.pie([q1 q2 q3 q4] labels=['Q1' 'Q2' 'Q3' 'Q4']) plt.show(). Each chart suits a different purpose: line for trends bar for comparison pie for proportions.
Table-Based Questions4 questions
Q286 Marks
Match each matplotlib chart type with its best use.
Chart
Best for
Line plot
?
Bar chart
?
Histogram
?
Pie chart
?
Scatter plot
?
Box plot
?
Q296 Marks
Match each matplotlib function with its purpose.
Function
Purpose
plt.plot()
?
plt.bar()
?
plt.pie()
?
plt.hist()
?
plt.title()
?
plt.show()
?
Q305 Marks
Match each plot customisation with its parameter.
Q313 Marks
Study the matplotlib functions table and answer:
Function
Purpose
plt.plot()
Line plot
plt.bar()
Vertical bar chart
plt.pie()
Pie chart
plt.hist()
Histogram
plt.scatter()
Scatter plot
plt.title()
Set title
plt.show()
Display plot
Which is used for frequency distribution of continuous data?
Aplt.bar()
Bplt.hist()
Cplt.line()
Dplt.pie()
Which creates a horizontal bar chart?
Aplt.bar()
Bplt.barh()
Cplt.pie()
Dplt.scatter()
Discuss any five common chart types in matplotlib and when each is appropriate.
Show answersHide answers
1. Option 2 — plt.hist()
2. Option 2 — plt.barh()
3. Matplotlib offers many chart types — line for trends bar for comparison histogram for frequency distribution pie for proportions scatter for correlation between two variables. Customisation includes title labels legend grid colours markers line styles. The standard alias for matplotlib.pyplot is plt. Always call plt.show() to display the figure (or plt.savefig() to save).
Picture-Based Questions3 questions
Q323 Marks
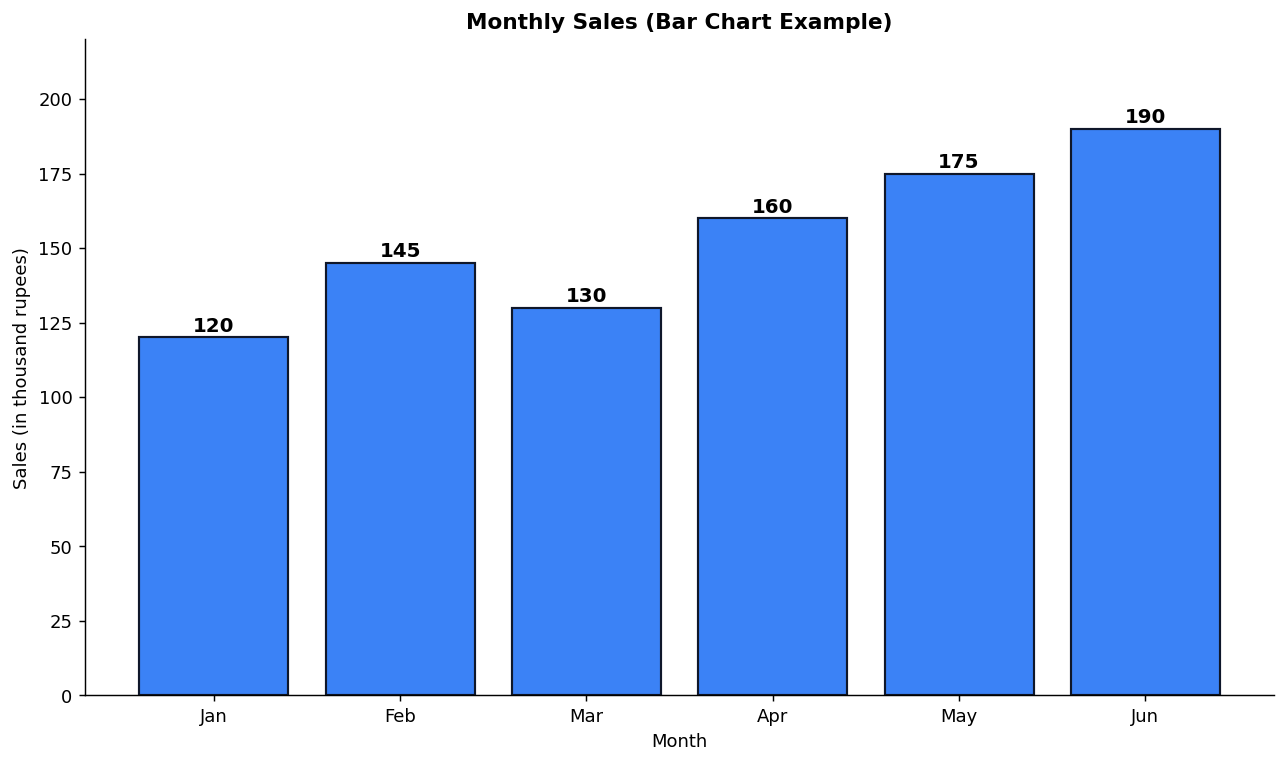
Study the monthly sales bar chart and answer:
Which month has the highest sales?
AJan
BFeb
CMay
DJun
Which matplotlib function is used to draw this chart?
Aplt.line()
Bplt.bar()
Cplt.pie()
Dplt.hist()
Discuss when a bar chart is appropriate and how to create one in matplotlib.
Show answersHide answers
1. Option 4 — Jun
2. Option 2 — plt.bar()
3. A bar chart is created with plt.bar(categories values). It is best for comparing categorical values like monthly sales. Each bar's height represents the value. Add labels with plt.xlabel() plt.ylabel() and plt.title(). Use plt.show() to display or plt.savefig() to save. Customise colours using the color parameter.
Q333 Marks
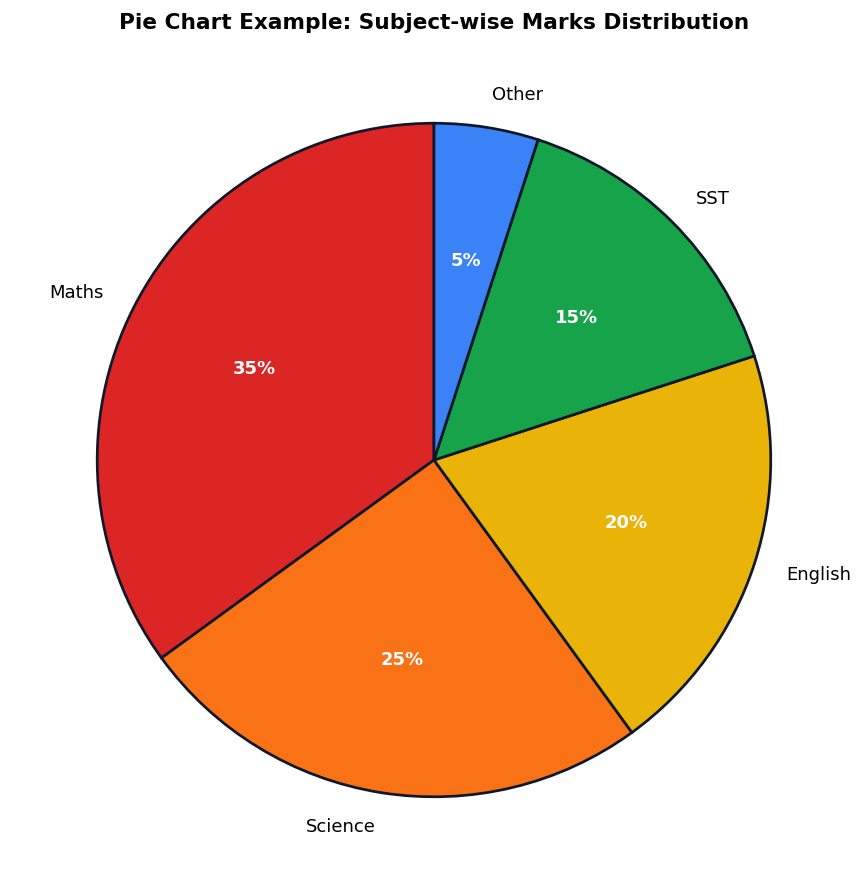
Study the pie chart example and answer:
Which subject has the highest share?
AMaths
BScience
CEnglish
DSST
Which matplotlib function creates this chart?
Aplt.bar()
Bplt.pie()
Cplt.hist()
Dplt.scatter()
Discuss when a pie chart is appropriate and how to create one in matplotlib.
Show answersHide answers
1. Option 1 — Maths
2. Option 2 — plt.pie()
3. Pie charts show proportions of a whole. Each slice represents a category and its size is proportional to the value. Use plt.pie(values labels=labels autopct='%1.0f%%'). Pie charts are best when there are 2-7 categories that sum to 100 percent.
Q343 Marks
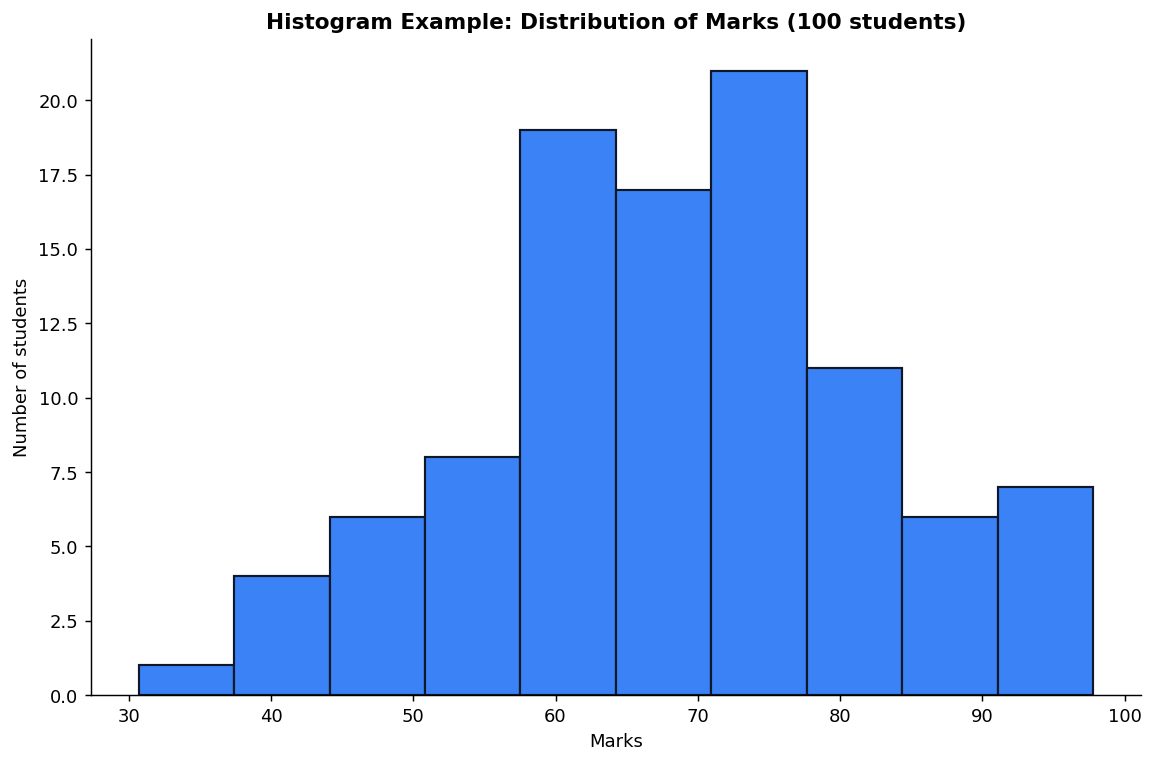
Study the histogram example and answer:
The chart shown is a:
ABar chart
BPie chart
CHistogram
DLine plot
Which matplotlib function creates a histogram?
Aplt.bar()
Bplt.hist()
Cplt.pie()
Dplt.scatter()
Differentiate between histogram and bar chart and explain when to use each.
Show answersHide answers
1. Option 3 — Histogram
2. Option 2 — plt.hist()
3. A histogram displays the frequency distribution of a continuous variable by grouping data into intervals (bins). Use plt.hist(data bins=10). The x-axis shows the value range; the y-axis shows the count. Histograms differ from bar charts in that bars touch each other (continuous) and the variable is numeric not categorical.