Analysis of Financial Statements — Important Questions
58 questions
With answersCBSE format
SUMMARY: The chapter focuses on understanding and interpreting financial statements to assess the financial health and performance of a business. KEY TOPICS: financial statements, comparative statements, common size statements, ratio analysis, liquidity ratios, profitability ratios, solvency ratios, trend analysis, limitations of financial analysis, cash flow analysis
What does liquidity ratio measure in financial statements?
AProfitability of a company
BAbility to meet short-term obligations
CLong-term financial stability
DOverall market performance
Check answerHide answer
Correct answer: Option 2 — Ability to meet short-term obligations
Q71 Mark
Which of the following is a limitation of financial analysis?
AProvides a clear picture of financial health
BBased on historical data
CHelps in decision making
DAssists in performance evaluation
Check answerHide answer
Correct answer: Option 2 — Based on historical data
Q81 Mark
What is the primary purpose of cash flow analysis?
ATo evaluate profitability
BTo assess liquidity
CTo determine solvency
DTo analyze market trends
Check answerHide answer
Correct answer: Option 2 — To assess liquidity
Q91 Mark
In a common-size statement, which of the following is typically used as a base for comparison?
ATotal liabilities
BTotal revenue
CTotal assets
DNet income
Check answerHide answer
Correct answer: Option 3 — Total assets
Q101 Mark
Which ratio indicates a company's ability to cover its long-term debts?
ACurrent ratio
BQuick ratio
CDebt to equity ratio
DReturn on equity
Check answerHide answer
Correct answer: Option 3 — Debt to equity ratio
Q111 Mark
What does a high current ratio indicate?
APoor liquidity position
BStrong liquidity position
CHigh profitability
DLow solvency
Check answerHide answer
Correct answer: Option 2 — Strong liquidity position
Q121 Mark
Which of the following is NOT a profitability ratio?
AGross profit margin
BNet profit margin
CReturn on assets
DCurrent ratio
Check answerHide answer
Correct answer: Option 4 — Current ratio
Q131 Mark
What is the main focus of trend analysis?
AComparing financial statements of different companies
BEvaluating financial performance over time
CAssessing market conditions
DAnalyzing cash flows
Check answerHide answer
Correct answer: Option 2 — Evaluating financial performance over time
Q141 Mark
Which financial statement provides information about a company's revenues and expenses?
ABalance sheet
BIncome statement
CCash flow statement
DEquity statement
Check answerHide answer
Correct answer: Option 2 — Income statement
Q151 Mark
What does the debt to equity ratio measure?
ALiquidity of the company
BProfitability of the company
CFinancial leverage of the company
DOperational efficiency of the company
Check answerHide answer
Correct answer: Option 3 — Financial leverage of the company
Short Answer Questions10 questions
Q163 Marks
What is meant by analysis of financial statements? List its objectives.
View sample solutionHide solution
Analysis of financial statements means systematically examining the figures in the financial statements to assess profitability, liquidity, solvency, and operational efficiency. Objectives: (i) judge the financial performance and position of the enterprise; (ii) compare performance over years (intra-firm) and with other firms (inter-firm); (iii) assess earning capacity; (iv) evaluate solvency and credit-worthiness; (v) help managers in planning and control; (vi) help investors in making investment decisions; (vii) help creditors and lenders assess risk.
Q173 Marks
List the various tools/techniques of financial statement analysis.
View sample solutionHide solution
(1) COMPARATIVE statements — show absolute and percentage changes year-over-year. (2) COMMON-SIZE statements — express every item as a percentage of a base (revenue from operations for P&L; total of equity/liabilities or assets for balance sheet); enables comparison across firms of different sizes. (3) TREND analysis — selects a base year and expresses subsequent years as a percentage of base. (4) RATIO analysis — computes financial ratios (liquidity profitability solvency activity). (5) CASH FLOW analysis — analyses inflows and outflows of cash. (6) FUNDS FLOW analysis — analyses changes in working capital. Each technique reveals different aspects.
Q183 Marks
Distinguish between comparative and common-size statements.
View sample solutionHide solution
Comparative statements: present financial data for two or more periods side by side; show absolute amounts and absolute/percentage CHANGES. Useful for trend analysis. Format: column for each period plus columns for change in absolute terms and as percentage. Common-size statements: express each item as a PERCENTAGE of a common base (revenue for P&L, total of equity & liabilities for balance sheet); show structural composition. Useful for inter-firm comparison and for analysing the relative weight of items within one period. Both can be applied to the balance sheet or the P&L.
Q193 Marks
Explain the limitations of financial statement analysis.
View sample solutionHide solution
Limitations: (1) Based on historical data — does not predict the future. (2) Based on accounting figures — accounting policies (depreciation methods, inventory valuation) affect comparability. (3) Ignores qualitative factors — quality of management employees brand value not captured. (4) Subject to window dressing — manipulating figures to mislead. (5) Inflation effect — historical cost ignores price-level changes. (6) Inter-firm comparison difficult — different accounting policies, sizes, sectors. Despite these limitations, analysis is essential — caveats must be noted but the data still provides useful insights.
Q203 Marks
List the parties interested in financial statement analysis.
View sample solutionHide solution
(1) Investors (shareholders) — return on investment and risk; (2) Lenders/creditors — solvency and ability to repay debt; (3) Management — planning control and strategic decisions; (4) Government and tax authorities — tax compliance and policy formulation; (5) Employees — job security wages and bonuses; (6) Customers — continuity of supply and warranties; (7) Suppliers — credit-worthiness; (8) Researchers and analysts — for academic and market analysis; (9) Competitors — benchmarking. Each user looks at different aspects of the same statements.
Q213 Marks
What are liquidity ratios and why are they important for a business?
View sample solutionHide solution
Liquidity ratios measure a company's ability to meet its short-term obligations. They are important because they indicate the financial health of a business and its capacity to cover immediate liabilities without needing to sell long-term assets.
Q223 Marks
Define profitability ratios and provide an example of one such ratio.
View sample solutionHide solution
Profitability ratios assess a company's ability to generate profit relative to its revenue, assets, or equity. An example is the Net Profit Margin, which shows the percentage of revenue that remains as profit after all expenses are deducted.
Q233 Marks
What is trend analysis in financial statements?
View sample solutionHide solution
Trend analysis involves comparing financial data over multiple periods to identify patterns or trends in performance. This helps stakeholders understand whether a company's financial health is improving or deteriorating over time.
Q243 Marks
Explain the significance of solvency ratios in financial analysis.
View sample solutionHide solution
Solvency ratios assess a company's ability to meet its long-term debts and obligations. They are significant because they provide insights into the financial stability and long-term viability of a business.
Q253 Marks
What is a common-size statement and how is it useful in financial analysis?
View sample solutionHide solution
A common-size statement expresses each line item as a percentage of a base figure, such as total revenue or total assets. This allows for easier comparison between companies of different sizes and helps in analyzing trends over time.
Long Answer Questions6 questions
Q266 Marks
Prepare a comparative balance sheet from the following: 31 Mar 2023 — Equity ₹400000, Reserves ₹100000, LT Borrowings ₹200000, Current Liab ₹50000; 31 Mar 2024 — Equity ₹500000, Reserves ₹150000, LT Borrowings ₹180000, Current Liab ₹60000. (Assets: Fixed assets ₹500000 → ₹650000; Current assets ₹250000 → ₹240000.)
Prepare a common-size P&L statement: Revenue ₹500000; Cost of Materials ₹200000; Employee Benefits ₹100000; Other Expenses ₹50000; Finance Costs ₹20000; Depreciation ₹30000; Tax @25% on profit before tax.
View sample solutionHide solution
Common-size P&L (% of Revenue from Operations): Revenue 500000 (100%); Cost of Materials 200000 (40%); Employee Benefits 100000 (20%); Other Expenses 50000 (10%); Finance Costs 20000 (4%); Depreciation 30000 (6%); Total Expenses 400000 (80%); Profit Before Tax 100000 (20%); Tax @25% × 100000 = 25000 (5%); Profit After Tax 75000 (15%). The percentages reveal the cost structure: 40% of revenue goes to materials (the largest cost), 20% to employees. Compare across firms of different sizes by looking at percentages rather than absolute amounts.
Q286 Marks
Compute trend percentages with 2021 as base year for these revenues: 2021 ₹500000; 2022 ₹600000; 2023 ₹720000; 2024 ₹800000.
View sample solutionHide solution
Trend Percentage = (Year value / Base year value) × 100. Base year (2021) = 100%. 2022 = 600000 / 500000 × 100 = 120%. 2023 = 720000 / 500000 × 100 = 144%. 2024 = 800000 / 500000 × 100 = 160%. Insight: Revenue has grown 60% over 3 years (CAGR of about 17% per year). The trend is upward consistent and accelerating — indicates strong business growth. Trend analysis is best applied to multiple line items (revenue costs profit) and over 5+ years to spot direction and momentum. Useful in identifying turning points and divergence (e.g., revenue growing but profit margin shrinking).
Q296 Marks
Discuss the importance and limitations of comparative statements.
View sample solutionHide solution
Importance: (1) Trend identification — visualises improvement or deterioration year-on-year; (2) Performance evaluation — quick view of growth in revenue, profit, assets; (3) Decision-making aid for investors lenders managers; (4) Identifies areas needing attention (e.g., operating cost rising faster than revenue). Limitations: (1) Only two periods compared at a time — long-term trend requires multiple years; (2) Inter-firm comparison difficult due to size differences (resolved by common-size); (3) Inflation distorts year-on-year comparison if not adjusted; (4) Changes in accounting policies make comparisons unreliable; (5) Qualitative factors (management quality brand) not captured. Comparative statements are most useful WITH other techniques (common-size ratio analysis trend analysis) for a complete picture.
Q306 Marks
Discuss the various users of financial statement analysis and their specific information needs.
View sample solutionHide solution
INVESTORS — focus on profitability (P&L) earnings per share dividend payout return on equity; investment decision (buy/hold/sell). LENDERS/CREDITORS — focus on debt-equity ratio interest coverage current ratio; lend or not, at what rate. MANAGEMENT — uses internal reports for planning control budgeting and strategy; comprehensive view of all metrics. GOVERNMENT — tax computation industry policy formulation revenue forecasts. EMPLOYEES — job security future bonus negotiations. CUSTOMERS — continuity of supply warranty service availability. SUPPLIERS — payment timeliness creditworthiness for extending credit. RESEARCHERS — academic studies industry analysis. COMPETITORS — benchmarking and competitive positioning. Each user prioritises different parts of the analysis.
Q316 Marks
Differentiate between horizontal analysis and vertical analysis of financial statements in tabular form.
Assertion–Reason Questions8 questions
Q321 Mark
Assertion (A): Financial statement analysis helps users assess the financial health of a business.
Reason (R): The analysis processes raw figures into meaningful indicators of profitability liquidity and solvency.
Show explanationHide explanation
Correct answer: Option 1 —
Both A and R are true, and R is the correct explanation of A.
Q331 Mark
Assertion (A): Common-size statements express items as percentages of a base.
Reason (R): Common-size enables comparison across firms of different sizes and across years.
Show explanationHide explanation
Correct answer: Option 1 —
Both A and R are true, and R is the correct explanation of A.
Q341 Mark
Assertion (A): Comparative statements show absolute and percentage changes year-on-year.
Reason (R): The technique helps identify growth or decline in specific items.
Show explanationHide explanation
Correct answer: Option 1 —
Both A and R are true, and R is the correct explanation of A.
Q351 Mark
Assertion (A): Trend analysis is best done over 5 or more years.
Reason (R): A long base period reveals the general direction of business and helps spot turning points.
Show explanationHide explanation
Correct answer: Option 1 —
Both A and R are true, and R is the correct explanation of A.
Q361 Mark
Assertion (A): Analysis based purely on historical figures has limitations.
Reason (R): Past performance is not always indicative of future performance.
Show explanationHide explanation
Correct answer: Option 1 —
Both A and R are true, and R is the correct explanation of A.
Q371 Mark
Assertion (A): Liquidity ratios are used to measure a company's ability to meet its short-term obligations.
Reason (R): A higher liquidity ratio indicates better financial health in terms of short-term solvency.
Show explanationHide explanation
Correct answer: Option 1 —
Both A and R are true, and R is the correct explanation of A.
Q381 Mark
Assertion (A): Profitability ratios provide insights into a company's ability to generate earnings relative to its revenue.
Reason (R): These ratios are calculated using only the income statement figures.
Show explanationHide explanation
Correct answer: Option 2 —
Both A and R are true, but R is not the correct explanation of A.
Q391 Mark
Assertion (A): Solvency ratios assess a company's long-term financial stability.
Reason (R): These ratios are primarily derived from the balance sheet and do not consider cash flow.
Show explanationHide explanation
Correct answer: Option 3 —
A is true, but R is false.
Statement-Based Questions8 questions
Q401 Mark
Statement 1: Comparative and common-size are tools of vertical and horizontal analysis.
Statement 2: Ratio analysis provides indicators of liquidity profitability and solvency.
Show answerHide answer
Correct answer: Option 1 —
Both statements are true.
Q411 Mark
Statement 1: Common-size statements are useful for inter-firm comparison.
Statement 2: Different firms can be compared on a relative scale rather than absolute size.
Show answerHide answer
Correct answer: Option 1 —
Both statements are true.
Q421 Mark
Statement 1: Investors lenders and management are key users of analysis.
Statement 2: Each user focuses on different aspects of the financial statements.
Show answerHide answer
Correct answer: Option 1 —
Both statements are true.
Q431 Mark
Statement 1: Inflation and changes in accounting policies limit comparability.
Statement 2: Such factors can distort year-on-year comparisons.
Show answerHide answer
Correct answer: Option 1 —
Both statements are true.
Q441 Mark
Statement 1: Quality of management and brand value are not reflected in financial statements.
Statement 2: Hence quantitative analysis must be supplemented with qualitative judgement.
Show answerHide answer
Correct answer: Option 1 —
Both statements are true.
Q451 Mark
Statement 1: Liquidity ratios measure a company's ability to meet its short-term obligations.
Statement 2: Profitability ratios assess a company's overall financial health and long-term viability.
Show answerHide answer
Correct answer: Option 2 —
Only Statement 1 is true.
Q461 Mark
Statement 1: Trend analysis involves comparing financial data over multiple periods to identify patterns.
Statement 2: Common size statements express each line item as a percentage of total revenue.
Show answerHide answer
Correct answer: Option 1 —
Both statements are true.
Q471 Mark
Statement 1: Solvency ratios are used to evaluate a company's ability to generate profits.
Statement 2: Cash flow analysis helps in understanding the cash inflows and outflows of a business.
Show answerHide answer
Correct answer: Option 3 —
Only Statement 2 is true.
Case Study / Passage Questions4 questions
Q483 Marks
M/s Kapur Industries has these balances. 31 March 2023: Equity Capital ₹400000, Reserves ₹100000, Long-term Borrowings ₹200000, Current Liabilities ₹50000, Fixed Assets ₹500000, Current Assets ₹250000. 31 March 2024: Equity Capital ₹500000, Reserves ₹150000, Long-term Borrowings ₹180000, Current Liabilities ₹60000, Fixed Assets ₹650000, Current Assets ₹240000.
The technique that shows changes year-on-year is:
AComparative statement
BCommon-size statement
CTrend analysis
DCash flow
Equity capital change as percentage =
A+25%
B+50%
C+10%
D−10%
Prepare the comparative balance sheet showing changes.
Show answersHide answers
1. Option 1 — Comparative statement
2. Option 1 — +25%
3. Comparative Balance Sheet showing absolute and percentage changes. Equity Capital 400000→500000 (Δ +100000 +25%); Reserves 100000→150000 (+50000 +50%); Long-term Borrowings 200000→180000 (−20000 −10%); Current Liab 50000→60000 (+10000 +20%); Total Liab/Equity 750000→890000 (+140000 +18.7%). Fixed Assets 500000→650000 (+150000 +30%); Current Assets 250000→240000 (−10000 −4%); Total Assets 750000→890000 (+140000 +18.7%). Insights: Capital grew strongly (+25%); Reserves grew faster (+50%) suggesting profit retention; Long-term borrowings reduced (−10%); Fixed Assets grew significantly (+30%) — indicates capital investment. Comparative analysis is best paired with common-size and trend analysis for a complete picture.
Q493 Marks
M/s Reema Ltd has these P&L figures. Revenue ₹500000; Cost of Materials ₹200000; Employee Benefits ₹100000; Other Expenses ₹50000; Finance Costs ₹20000; Depreciation ₹30000; Tax @25% on profit before tax.
The technique that expresses items as percentage of base is:
AComparative
BCommon-size
CTrend
DCash flow
Cost of Materials as % of Revenue =
A40% of Revenue
B80% of Revenue
C20% of Revenue
D15% of Revenue
Prepare a common-size P&L and explain insights.
Show answersHide answers
1. Option 2 — Common-size
2. Option 1 — 40% of Revenue
3. Common-size P&L (% of Revenue from Operations): Revenue 500000 (100%); Cost of Materials 200000 (40%); Employee Benefits 100000 (20%); Other Expenses 50000 (10%); Finance Costs 20000 (4%); Depreciation 30000 (6%); Total Expenses 400000 (80%); Profit Before Tax 100000 (20%); Tax @25% × 100000 = 25000 (5%); Profit After Tax 75000 (15%). The percentages reveal cost structure: 40% of revenue goes to materials (the largest cost), 20% to employees. Compare with industry benchmarks or different firms — those with materials costs higher than 40% may have pricing or supply-chain issues. Common-size statements enable fair comparison across firms of different sizes.
Q503 Marks
M/s Verma Stores has these annual revenues: 2020 ₹500000; 2021 ₹600000; 2022 ₹720000; 2023 ₹800000; 2024 ₹900000. The company wants to understand its growth pattern.
The technique using a base year and percentages is:
AComparative
BCommon-size
CTrend analysis
DRatio
2024 trend % (base 2020 = 100) =
A144%
B160%
C180%
D100%
Compute trend percentages and discuss the insight.
Show answersHide answers
1. Option 3 — Trend analysis
2. Option 3 — 180%
3. Trend analysis with 2020 as base year (= 100%). 2021: 600000/500000 × 100 = 120%. 2022: 720000/500000 × 100 = 144%. 2023: 800000/500000 × 100 = 160%. 2024: 900000/500000 × 100 = 180%. Insight: Revenue has grown 80% over 4 years (CAGR ≈ 16% per year). The trend is upward and consistent — indicates strong business growth. Trend analysis is most useful when applied to multiple line items (revenue costs profit) and over 5+ years. It reveals long-term direction but should be combined with other techniques (common-size ratio analysis) for a complete picture. A consistently rising trend in costs while revenue plateaus would signal margin pressure.
Q513 Marks
The analysis of financial statements is crucial for stakeholders to evaluate a company's performance and financial health. Financial statements include the balance sheet, income statement, and cash flow statement. Comparative statements allow for the analysis of financial data over different periods, highlighting trends and changes in financial performance. Common size statements express each line item as a percentage of a base figure, facilitating comparison across companies of different sizes. Ratio analysis is a key tool in this process, where various ratios such as liquidity ratios, profitability ratios, and solvency ratios are calculated to assess different aspects of a company's financial condition. For instance, liquidity ratios measure a company's ability to meet short-term obligations, while profitability ratios evaluate its ability to generate profit relative to sales, assets, or equity. Understanding these concepts helps stakeholders make informed decisions regarding investments, credit, and management strategies.
What is the primary purpose of analyzing financial statements?
ATo prepare tax returns
BTo evaluate company performance
CTo determine employee salaries
DTo create marketing strategies
Define common size statements and their significance.
Which type of ratio assesses a company's ability to meet short-term obligations?
AProfitability ratios
BLiquidity ratios
CSolvency ratios
DEfficiency ratios
Show answersHide answers
1. Option 2 — To evaluate company performance
2. Common size statements express each line item as a percentage of a base figure, allowing for easier comparison across companies and periods.
3. Option 2 — Liquidity ratios
Table-Based Questions4 questions
Q523 Marks
Compare tools of financial statement analysis:
Tool
What it shows
Best for
Comparative
Year-on-year changes
Identifying trends
Common-size
Items as % of base
Inter-firm comparison
Trend analysis
% over 5+ years from base
Long-term direction
Ratio analysis
Single-figure indicators
Comparing performance
Cash flow
Cash inflows/outflows
Liquidity assessment
Common-size analysis is best for:
ATrend
BCommon-size
CComparative
DRatio
Trend analysis is best done over:
A5+ years
B1 year
C1 month
DRandom
Why are multiple tools used together rather than relying on one?
Show answersHide answers
1. Option 2 — Common-size
2. Option 1 — 5+ years
3. Each tool of financial analysis has distinct strengths. Comparative statements show year-on-year movement and reveal direction of change. Common-size statements normalise figures by expressing items as percentages of a common base — perfect for comparing firms of different sizes. Trend analysis tracks long-term movement of selected items over 5+ years using a base year. Ratio analysis provides single-figure indicators of liquidity profitability solvency and activity. Cash flow analysis reveals how cash has been generated and used. Best practice: use multiple tools together. Comparative + common-size shows both absolute and relative changes; trend reveals long-term direction; ratios benchmark performance.
Q533 Marks
Users of financial statement analysis and their information needs:
User
Information needed
Decision
Investors
Profitability, EPS, dividend
Buy/hold/sell
Lenders
Solvency, debt-equity
Lend/at what rate
Management
All metrics
Plan/control
Government
Tax compliance
Tax assessment
Employees
Profitability, growth
Job security/bonus
Customers
Continuity
Continued supply
Suppliers
Creditworthiness
Extend credit
Who is most interested in debt-equity ratio?
AInvestors
BLenders
CGovernment
DCustomers
Who looks at creditworthiness for extending trade credit?
ASuppliers
BInvestors
CEmployees
DGovernment
Why does each user focus on different parts of the analysis?
Show answersHide answers
1. Option 2 — Lenders
2. Option 1 — Suppliers
3. Different users have different information needs. Investors focus on profitability and return — they decide whether to invest more or exit. Lenders focus on solvency (debt-equity interest coverage) — to lend or not, at what rate. Management uses comprehensive analysis for planning control and strategic decisions. Government cares about tax compliance and revenue. Employees look for stability and growth — for job security and bonus negotiations. Customers want continuity of supply and warranty coverage. Suppliers assess creditworthiness for extending trade credit. The same financial statements serve all users but each focuses on different parts of the analysis.
Q546 Marks
Prepare a comparative balance sheet for M/s Kapur Industries showing absolute and percentage changes.
Item
31 Mar 2023
31 Mar 2024
Equity Capital
₹400000
₹500000
Reserves
₹100000
₹150000
Long-term Borrowings
₹200000
₹180000
Current Liabilities
₹50000
₹60000
Fixed Assets
₹500000
₹650000
Current Assets
₹250000
₹240000
Q556 Marks
Prepare a common-size P&L statement for M/s Reema Ltd showing each item as a percentage of revenue.
Item
Amount
Revenue
₹500000
Cost of Materials
₹200000
Employee Benefits
₹100000
Other Expenses
₹50000
Finance Costs
₹20000
Depreciation
₹30000
Tax rate
25%
Picture-Based Questions3 questions
Q562 Marks
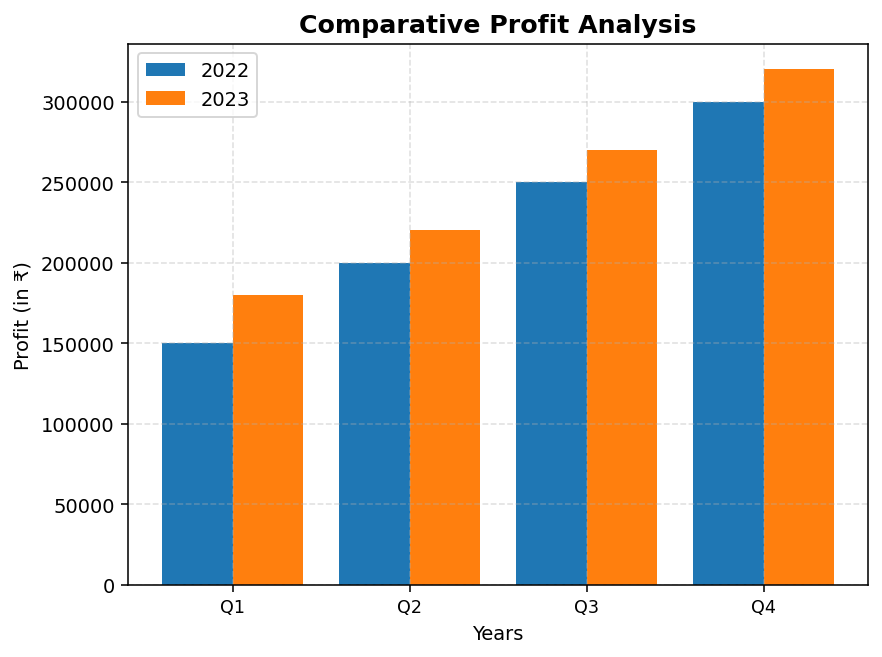
Based on the given chart, answer the following:
Which quarter showed the highest profit in 2023?
AQ1
BQ2
CQ3
DQ4
What is the total profit for 2022?
What percentage of total expenses is allocated to Marketing?
A10%
B15%
C20%
D25%
Calculate the total percentage of expenses for Salaries and Rent combined.
Show answersHide answers
1. Option 4 — Q4
2. 900000
3. Option 3 — 20%
4. 55%
Q572 Marks
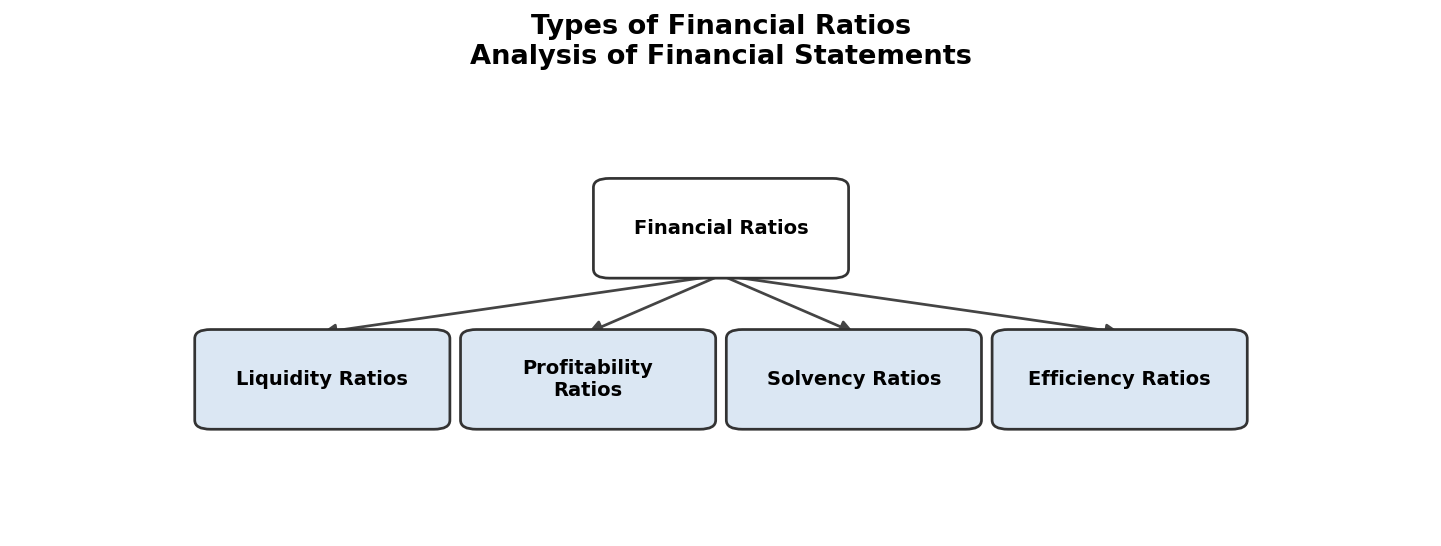
Based on the given flowchart, answer the following:
Which type of ratio assesses a company's ability to meet short-term obligations?
ALiquidity Ratios
BProfitability Ratios
CSolvency Ratios
DEfficiency Ratios
List one example of a profitability ratio.
Which limitation refers to the reliance on past performance?
AHistorical Data
BSubjectivity
CNon-Financial Factors
DWindow Dressing
Explain what is meant by 'Window Dressing' in financial statements.
Show answersHide answers
1. Option 1 — Liquidity Ratios
2. Net Profit Margin
3. Option 1 — Historical Data
4. Manipulating financial statements to present a more favorable picture.
Q582 Marks
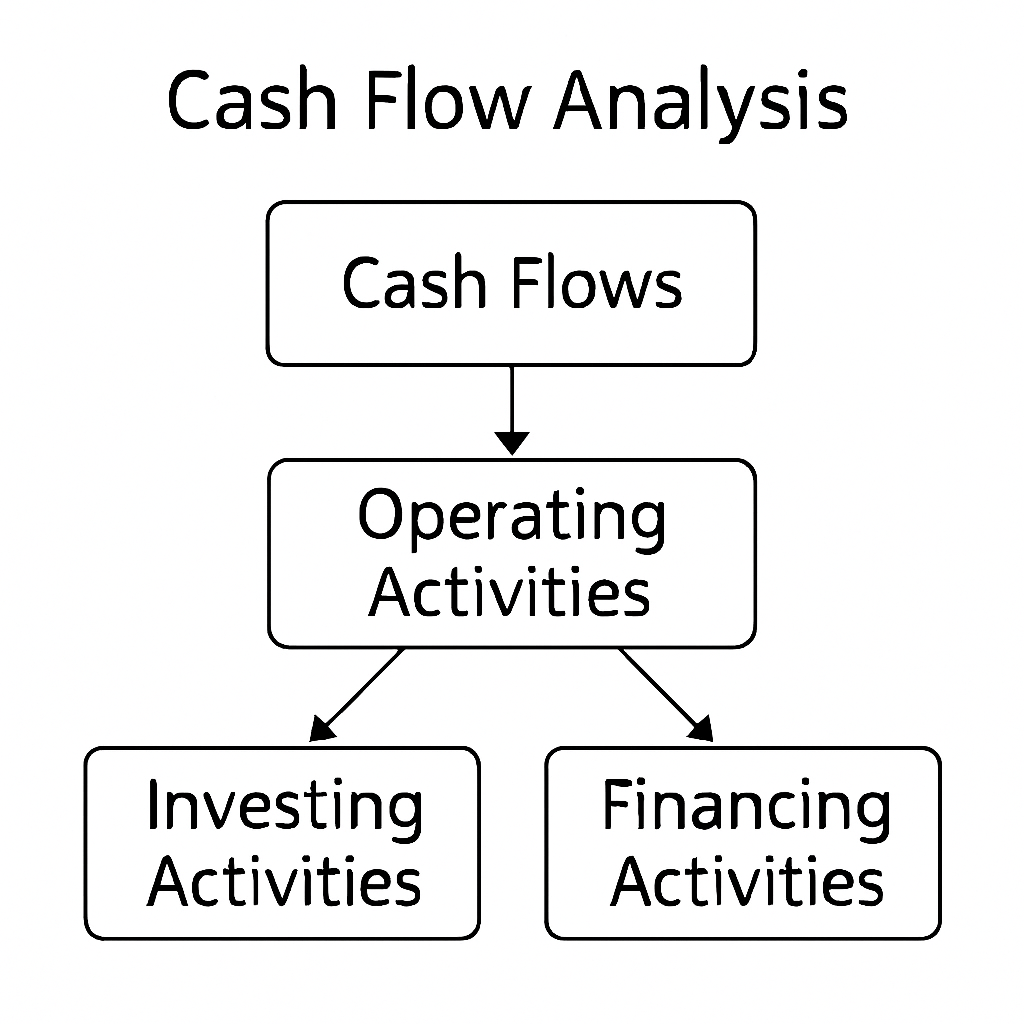
Based on the given diagram of cash flow analysis, answer the following:
What are the three main activities involved in cash flow analysis?
AOperating, Investing, Financing
BRevenue, Expense, Profit
CAssets, Liabilities, Equity
DSales, Purchases, Returns
Explain the importance of cash flow analysis in financial statements.
Show answersHide answers
1. Option 1 — Operating, Investing, Financing
2. It helps assess the liquidity and financial health of a business.